|
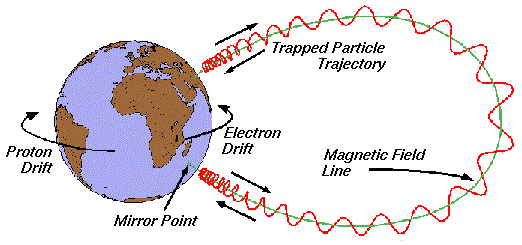
| Figure 1. Representation of the composite motion of charged particles trapped in the Earth's magnetic field. |
|---|
| Table of Contents | ECSS | Model Page |
| Background Information | Background Information | |
| Trapped particle radiation models | ||
This text presents a brief review of the main characteristics of the Earth's trapped radiation belts and of the engineering models that are used to evaluate mission fluences and doses. More detailed descriptions of the Earth's radiation environment and the related physical processes can be found in [Roederer, 1970; Walt, 1994; Lemaire et al., 1996].

|
| Figure 1. Representation of the composite motion of charged particles trapped in the Earth's magnetic field. |
|---|
The resulting trajectories lie on toroidal surfaces, called drift shells, centred on the Earth's dipole centre. Particles confined to a drift shell can remain there for long periods, up to years for protons at altitudes of a few thousand kilometers, whence the term "trapped particles".
The population of charged particles stably trapped by the Earth's magnetic field consists mainly of protons with energies between 100 keV and several hundred MeV and electrons with energies between a few tens of keV and 10 MeV. There is also evidence for the existence of a narrow region centred around altitudes of about one Earth radius containing trapped heavy ions which are believed to be decelerated anomalous cosmic ray ions; the intensities of these heavy ions are several orders of magnitude below the intensities of trapped energetic protons in this region.
|
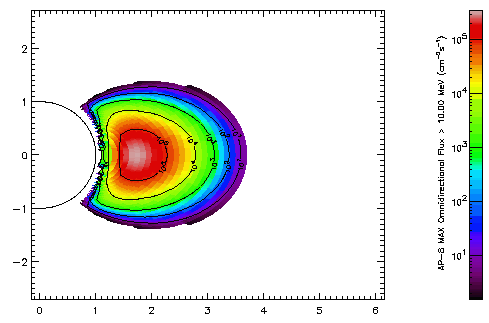
| Figure 2. Invariant coordinate map of the AP-8 MAX integral proton flux >10 MeV. The semi-circle represents the surface of the Earth, distances are expressed in Earth radii. |
|---|
|
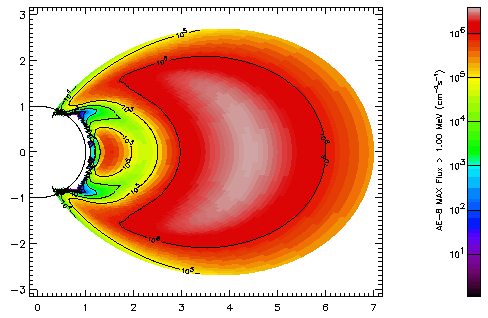
| Figure 3. Invariant coordinate map (see Fig. 2) of the AE-8 MAX integral electron flux >1 MeV. |
|---|
|
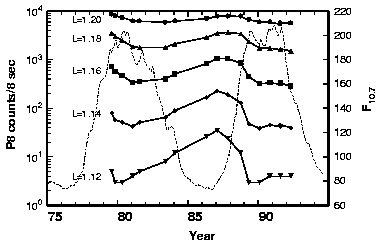
| Figure 4. Variation of proton count rates in the 80-215 MeV channel of the MEPED detector aboard the TIROS/NOAA spacecraft over the solar cycle as a function of L [Huston et al., 1996]. The dashed line shows the 13-month smoothed solar F10.7 flux. |
|---|
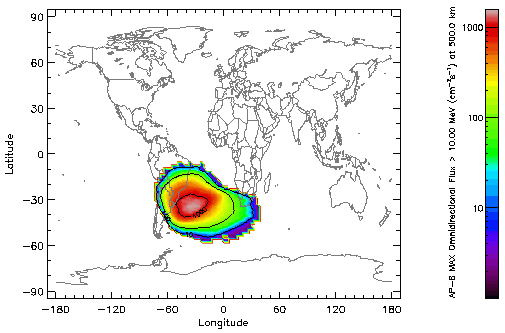
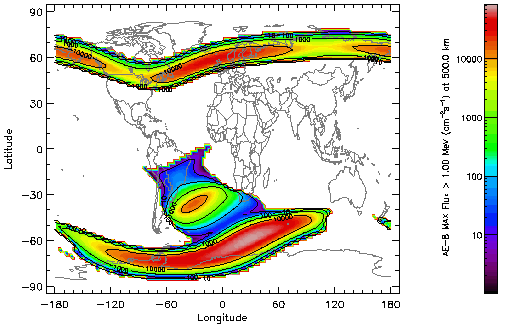
The separation of the dipole centre from the Earth's centre and the inclination of the magnetic axis with respect to the rotation axis produce a local depression in the low altitude magnetic field distribution at constant altitude. As the trapped particle population is tied to the magnetic field, the lowest altitude radiation environment (below about 1,000 km) peaks in the region where the magnetic field is depressed [Roederer, 1970]. This region is located to the south east of Brasil, and is called the South Atlantic Anomaly (SAA). Figures 5 and 6 represent a world map at 500 km altitude of the trapped proton (>10 MeV) and trapped electron (>1 MeV) distributions, respectively. The SAA shows up clearly in both maps. Proton fluxes are negligible outside the SAA, but electron fluxes can be very high at high latitudes where field lines from the outer electron belt reach down to low altitudes. A further effect of the secular change in the geomagnetic field is a slow westward drift of the SAA at a rate of 0.3 deg/year [Heynderickx, 1996].
|
| Figure 5. World map of the AP-8 MAX integral proton flux >10 MeV at 500 km altitude. |
|---|
|
| Figure 6. World map of the AE-8 MAX integral electron flux >1 MeV at 500 km altitude. |
|---|
|
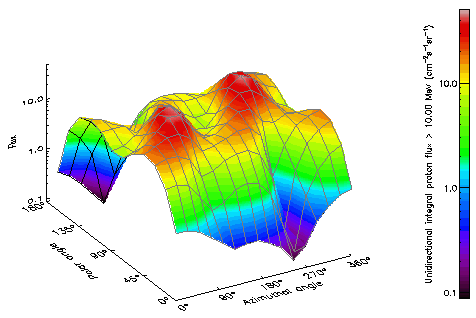
| Figure 7. Angular dependence of the AP-8 MAX integral proton flux >10 MeV, averaged over an 800 km heliosynchronous orbit. Angles are measured in a reference frame with its polar axis parallel to the satellite velocity vector. |
|---|
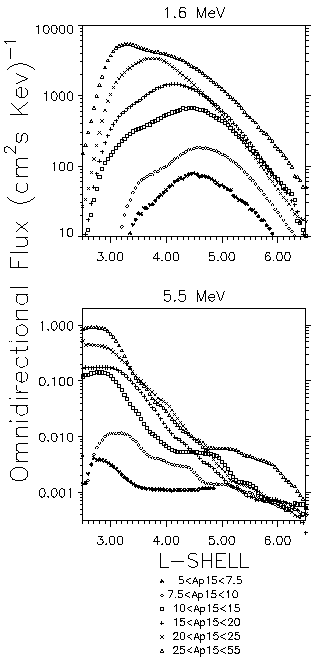
Outer zone electrons can vary in intensity by orders of magnitude over periods of a few hours. Measurements with instruments onboard the Combined Release and Radiation Effects Satellite (CRRES) have shown that there are also major changes in the spatial distributions of outer zone electrons [Gussenhoven et al., 1996a]. Gussenhoven et al. [1996b] have shown that the changes in flux and spatial distribution can be ordered by level of magnetospheric activity, i.c. the fifteen day running average of Ap. Figure 8 shows omnidirectional electron flux profiles on the magnetic equator as a function of McIlwain's [1961] L for six ranges of Ap15.
|
| Figure 8. Profiles of 1.6 MeV (top) and 5.5 MeV (bottom) omnidirectional electron flux on the magnetic equator, as a function of L, taken from the CRRES electron models for six ranges of Ap15 [Gussenhoven et al., 1996b]. |
|---|
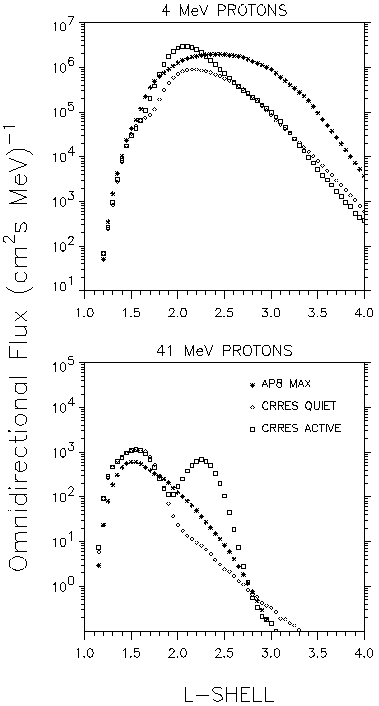
CRRES Data also demonstrated that magnetic storms can greatly influence the trapped proton population [Hudson et al., 1996]. The March 1991 storm created a second, stable high energy belt above L=1.8, with peak flux values exceeding pre-storm values by an order of magnitude [Gussenhoven et al., 1996b], as shown in Fig. 9. The newly-created proton belt decayed only very slowly and was still present six months later when the CRRES satellite was lost.
|
| Figure 9. Profiles of 4 MeV (top) and 41 MeV (bottom) omnidirectional proton flux on the magnetic equator, as a function of L, obtained with the CRRES quiet and active proton models and with AP-8 MAX [Gussenhoven et al., 1996b]. |
|---|
Low energy electrons contribute to spacecraft surface charging. High energy electrons injected and accelerated through the magnetotail can cause dielectric charge buildup deep inside geosynchronous spacecraft which may lead in turn to destructive arcing. Inner and outer belt electrons also contribute to ionising doses through direct energy deposition and bremsstrahlung effects.
High energy protons in the inner radiation belt are the main contributors to ionising dose deposition in shielded components. They also dominate Single Event Upset (SEU) rates at low altitudes and latitudes, where cosmic rays and solar energetic particles are effectively shielded by the geomagnetic field. Lower energy protons (up to 10 MeV) contribute to Non-Ionising Energy Loss (NIEL) dose which affects Charged-Coupled Devices (CCD) and other detectors; unshielded detectors can be affected even in the outer belt, where <1 MeV protons are present.
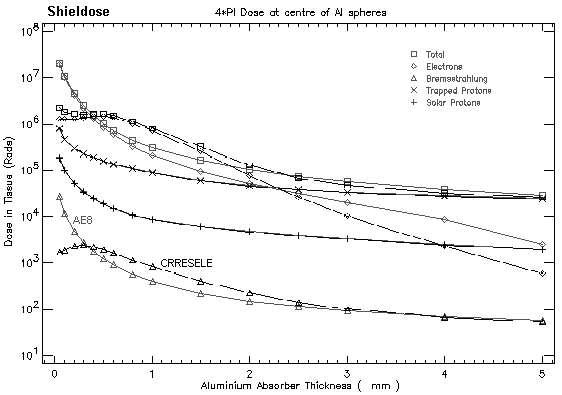
Figure 10 illustrates the importance of using an appropriate energy spectrum when evaluating radiation effects. The figure shows ionising doses obtained with SHIELDOSE, and compares the doses derived from two electron energy spectra: an AE-8 spectrum and a CRRESELE spectrum (a description of these and other trapped particle models is given below). For shielding thicknesses above 0.5 mm Al, the differences in the electron and Bremsstrahlung doses are due to differences in the AE-8 and CRRESELE models; as these models are based on different data sets, obtained for different epochs and under different conditions, substantial differences in the predicted electron fluxes are not unexpected. Below 0.5 mm Al thickness, however, the doses obtained from the CRRESELE spectrum are substantially lower than the doses obtained from the AE-8 spectrum. This discrepancy is due to the fact that the lower energy limit of the CRRESELE spectrum is much higher (0.123 MeV) than the AE-8 lower limit (0.04 MeV). Consequently, the lower energy electrons, which are able to penetrate the thin shieldings, are not present in the CRRESELE spectrum, and thus do not contribute to the electron and Bremsstrahlung doses obtained from the CRRESELE spectrum. For very thin shielding, the electron dose is the dominant contributor to the total dose, so that serious underestimates of the total dose can be obtained. Remark that the electrons below about 200KeV are primarily plasma electrons which have a different physics of origin than the higher energy particles.
Similar considerations apply to other trapped particle models that are now available, and to other radiation effects. Even with all their shortcomings, the AP-8 and AE-8 models are, up to now, the only ones that cover the full energy range needed to reliably evaluate the whole range of radiation effects. Therefore, it is recommended that radiation effect calculations, based on recent radiation models, should be backed up by a calculation using the AP-8 and AE-8 models, in order to check that no important radiation contributions are ignored.
|
| Figure 10. Comparisons of electron and Bremsstrahlung doses obtained with AE-8 and CRRESELE electron spectra. Note the substantial differences for shielding thickness below 0.5 mm Al. |
|---|
The NASA models are static and are in principle only valid for the period when the data for the models were obtained [Heynderickx et al., 1996b]. In view of the dynamic characteristics of the radiation belts outlined above, it is clear that correspondingly dynamic models are needed for accurate predictions of mission fluences and doses. Several efforts are under way to include dynamic behaviour in new radiation belt models, but up to now no models are available that duplicate the spatial and energy range of the NASA models. In order to achieve this, high quality data are needed from different locations in the magnetosphere, covering long time periods and with high resolution in energy, direction and time. Simple radiation monitors could easily be installed on commercial satellites, which would help the continuous upgrading needed for truly dynamic radiation belt models. However, as long as not all features of the radiation belts are fully understood or adequately modelled, high quality data are indispensable.
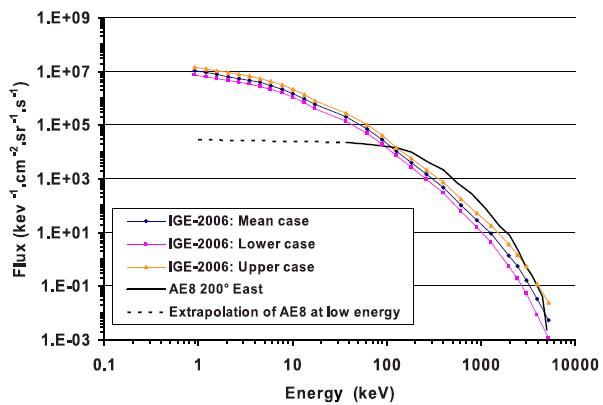
Specific for electron fluxes in geostationary orbit, models (POLE and IGE-2006) developed by ONERA & LANL (Boscher et al., 2003; Sicart-Piet et al., 2006 & 2008) are implemented in SPENVIS. Different from the NASA electron models at geostationary orbit, they depend on the solar cylce.
The trapped particle radiation models can also be run over a geographical coordinate grid and a magnetic coordinate grid
| Model |
Energy range (MeV) |
Coordinate range | Magnetic field models | Reference |
|---|---|---|---|---|
| Proton models | ||||
| AP-8 MIN | 0.1-400 |
1.14<=L<=6.6 1.0<=B/B0 up to the loss cone |
Internal: Jensen and Cain [1962]
External: None |
Sawyer and Vette, 1976 |
| AP-8 MAX | 0.1-400 |
1.14<=L<=6.6 1.0<=B/B0 up to the loss cone |
Internal: GSFC 12/66, updated to 1970 [Cain et al., 1967]
External: None |
Sawyer and Vette, 1976 |
| CRRESPRO | 1.1-90.4 |
1.0<=L<=5.5 1.0<=B/B0<=684.6 |
Internal: IGRF 1990
External: Olson-Pfitzer [1974] quiet |
Meffert and Gussenhoven, 1994 |
| SAMPEX/PET model PSB97 | 18-500 |
1.1<=L<=2.0 alpha0=90.0° down to the loss cone |
Internal: IGRF 1995
External: None |
Heynderickx et al., 1999 |
| AP-9 | 0.1-400 |
Internal: IGRF 2012
External: Olson-Pfitzer [1977] quiet |
Ginet et al., 2013 | |
| Electron models | ||||
| AE-8 MIN | 0.04-7 |
1.14<=L<=12 1.0<=B/B0 up to the loss cone |
Internal: Jensen and Cain [1962]
External: None |
Vette, 1991a |
| AE-8 MAX | 0.04-7 |
1.14<=L<=12 1.0<=B/B0 up to the loss cone |
Internal: Jensen and Cain [1962]
External: None |
Vette, 1991a |
| CRRESELE | 0.5-6.6 |
2.5<=L<=6.8 1.0<=B/B0<=684.6 |
Internal: IGRF 1990
External: Olson-Pfitzer [1974] quiet |
Brautigam and Bell, 1995 |
| AE-8 MIN update ESA-SEE1 | 0.04-7 |
1.14<=L<=12 1.0<=B/B0 up to the loss cone |
Internal: Jensen and Cain [1962]
External: None |
Vampola, 1996 |
| POLE - V1 | 0.03-2.5 | GEO | / | Boscher et al., 2003 |
| POLE - V2 | 0.03-5.2 | GEO | / | Sicard-Piet et al., 2006 |
| IGE-2006 | 0.001-5.2 | GEO | / | Sicard-Piet et al., 2008 |
| AE-9 | 0.04-10 |
Internal: IGRF 2012
External: Olson-Pfitzer [1977] quiet |
Ginet et al., 2013 | |
5.1 The NASA models AP-8 and AE-8 The AP-8 and AE-8 models [Vette, 1991b] consist of maps that contain omnidirectional, integral electron (AE maps) and proton (AP maps) fluxes in the energy range 0.04 MeV to 7 MeV for electrons and 0.1 MeV to 400 MeV for protons in the Earth's radiation belt. The fluxes are stored as functions of energy, L-value, and B/B0 (B0=0.311653/L3). The maps are based on data from more than 20 satellites from the early sixties to the mid-seventies. AE-8 and AP-8 are the latest editions in a series of updates starting with AE-1 and AP-1 in 1966 [Vette, 1991b].
None of the flux maps consider time variations beyond the solar cycle minimum/maximum distinction. In the AE-5 report for inner zone electrons, the three dominant time effects were investigated:
Large errors may occur in the AP-8 and AE-8 model fluxes where steep gradients in spatial and spectral distribution exist and where time variations are not well understood. A widely quoted error estimate is "a factor of 2." An even larger error must be considered for differential fluxes (in angle or energy) created from the omnidirectional, integral flux maps.
In SPENVIS, the original TRARA interpolation routine, delivered with the model flux maps [Vette, 1991b], was replaced by an improved algorithm that smoothes out irregularities in the model maps near the L grid points [Heynderickx et al., 1996b].
With permission from AFRL, the flux maps for these models have been included in the SPENVIS trapped particle radiation tool, in the framework of the ESA/ESTEC sponsored TREND (TRapped Radiation ENvironment Development) project. Details of the implementation can be found in Technical Note 10 of the TREND-3 study.
A full description of the model and its construction can be found in Technical Note 5 of the TREND-3 study. Please note that this is a directional model. As the radiation effects models require omnidirectional fluxes, SAMPEX/PET fluxes are multiplied by 4pi for the radiation effects models.
Work is now in progress on a dynamic proton model, based on 8 years of SAMPEX/PET data, that aims to reproduce the dependence of the low altitude trapped proton population on the solar cycle phase and on seasonal variations in the Earth's atmosphere.
The AE-8 environment is an update of the old AE-4 model using geosynchronous data from ATS 1, 5, and 6 and extreme extrapolations up the field line of low altitude data from OV3-3, OV1-19, and AZUR. The AE-4 model was known to be inaccurate, but it was the best available. The OV3-3 and OV1-19 data were obtained from a series of magnetic-focusing electron spectrometers designed and built at The Aerospace Corporation under the direction of A.L. Vampola. The CRRES MEA instrument was part of that series and originally was the backup for the OV1-19 instrument, although it was modified and refurbished prior to launch on CRRES. The AE-4 environment had been generated using a larger number of data sets, but those had been obtained by threshold detectors, with the exception of the OGO-1 and OGO-3 spectrometers. The OGO instruments (five-channel magnetic-focusing electron spectrometers similar in concept to the OV3-3, OV1-19 and CRRES spectrometers) provided highly reliable data, but due to the approach used (a pulsed electromagnet), the live-time was less than 1% and the data statistics were very poor. The other instruments had the typical problems of electron threshold detectors: very inaccurate energy determination and poor knowledge of detection efficiency.
Above 2 MeV, the AE-8 model is not based on reliable data. AZUR had a single threshold above this energy, but the efficiency as a function of energy was very uncertain. The OV1-19 had channels every 300 keV up to 5.1 MeV, but the raw data had been re-analyzed at NSSDC without consultation with the people who designed, calibrated, and flew the detector. Those doing this re-analysis mis-identified some of the channels, were not aware of calibration data taken with the instrument (including background responses), and used totally arbitrary "background corrections" to reduce the high energy fluxes to values with which they felt comfortable. The AE-8 model has been criticized also for its deficiency in high energy electrons at geosynchronous orbit [Baker et al., 1986]. In fact, above 2 MeV, the model is just an extrapolation of unknown validity.
In a project commissioned by ESA/ESTEC, CRRES MEA data were used to train neural networks to predict energetic electron fluxes using the magnetic index Kp as input. The trained networks then were used to produce estimates of electron flux intensities at 5 energies and 6 L values for each day from 10 January 1932 through 31 July 1996. The estimates were used to produce an update to AE-8 MIN.
A full description of the model and its construction can be found in the Final Report of the contract.
|
| Figure 11. Comparison of IGE-2006 with AE8 (flux vs. Energy) for an 11 year mission (with worst case and best case included) |
|---|
Baker, D. N., R. D. Belian, P. R. Higbie, R. W. Klebesadel, and J. B. Blake, Hostile Energetic Particle Radiation Environments in Earth's Outer Magnetosphere, in The Aerospace Environment at High Altitudes and its Implications for Spacecraft Charging and Communications, AGARD CP 406, 4-1, 1986.
Boscher, D. M., S. A. Bourdarie, R. H. W. Friedel, and R. D. Belian (2003), A model for the geostationary electron environment: POLE, IEEE Trans. Nucl. Sci., 50(6), 2278 -- 2283, doi:10.1109/TNS. 2003.821609.
Brautigam, D. H., and J. T. Bell, CRRESELE Documentation, PL-TR-95-2128, Environmental Research Papers, 1178, Phillips Laboratory, 1995.
Cain, J. C., Hendricks, S. J., Langel, R. A., and W. V. Hudson, A Proposed Model for the International Geomagnetic Reference Field-1965, J. Geomag. Geoelectr., 19, 335-355, 1967.
Fraser-Smith, A. C., Centered and Eccentric Geomagnetic Dipoles and Their Poles, 1600-1985, Rev. Geophys., 25, 1-16, 1987.
Ginet, G. P. et al., AE9, AP9 and SPM: New Models for Specifying the Trapped Energetic Particle and Space Plasma Environment, 2013
Gussenhoven, M. S., E. G. Mullen, and D. H. Brautigam, Improved Understanding of the Earth's Radiation Belts from the CRRES Satellite, IEEE Trans. Nucl. Sci., 43, 353-368, 1996a.
Gussenhoven, M. S., E. G. Mullen, and D. H. Brautigam, Phillips Laboratory Space Physics Division Radiation Models, in "Radiation Belts. Models and Standards", J.F. Lemaire, D. Heynderickx, and D.N. Baker (eds.), Geophysical Monograph 97, AGU, p. 93, 1996b.
Heynderickx, D., Comparison Between Methods to Compensate for the Secular Motion of the South Atlantic Anomaly, Nucl. Tracks Radiat. Meas., 26, 325-331, 1996.
Heynderickx, D., J. Lemaire, and E. J. Daly, Historical Review of the Different Procedures Used to Compute the L-Parameter, Radiat. Meas., 26, 325-331, 1996a.
Heynderickx, D., J. Lemaire, E. J. Daly, and H. D. R. Evans, Calculating Low-Altitude Trapped Particle Fluxes With the NASA Models AP-8 and AE-8, Radiat. Meas., 26, 947-952, 1996b.
Heynderickx, D., M. Kruglanski, V. Pierrard, J. Lemaire, M. D. Looper, and J. B. Blake, A Low Altitude Trapped Proton Model for Solar Minimum Conditions Based on SAMPEX/PET Data, IEEE Trans. Nucl. Sci., 46, 1475, 1999.
Hudson, M. K., S. R. Elkington, J. G. Lyon, V. A. Marchenko, I. Roth, M. Temerin, and M. S. Gussenhoven, MHD/Particle Simulations of Radiation Belt Formation During a Storm Sudden Commencement, in "Radiation Belts. Models and Standards", J.F. Lemaire, D. Heynderickx, and D.N. Baker (eds.), Geophysical Monograph 97, AGU, p. 57, 1996.
Huston, S. L., G. A. Kuck, and K. A. Pfitzer, Low Altitude Trapped Radiation Model Using TIROS/NOAA Data, in "Radiation Belts. Models and Standards", J. F. Lemaire, D. Heynderickx, and D. N. Baker (eds.), Geophysical Monograph 97, AGU, p. 119, 1996.
Jensen, D. C., and J. C. Cain, An Interim Geomagnetic Field, J. Geophys. Res., 67, 3568, 1962.
Kruglanski, M., Engineering tool for trapped proton flux anisotropy evaluation, Radiat. Meas., 26, 953, 1996.
Lemaire, J. F., D. Heynderickx, and D. N. Baker (eds), Radiation Belts. Models and Standards, Geophysical Monograph 97, AGU, 1996.
McIlwain, C. E., Coordinates for Mapping the Distribution of Magnetically Trapped Particles, J. Geophys. Res., 66, 3681-3691, 1961.
Meffert, J. D., and M. S. Gussenhoven, CRRESPRO Documentation, PL-TR-94-2218, Environmental Research Papers, 1158, Phillips Laboratory, 1994.
Olson, W. P., and K. A. Pfitzer, A Quantitative Model of the Magnetospheric Magnetic Field, J. Geophys. Res., 79, 3739-3748, 1974.
Roederer, J. G., Dynamics of Geomagnetically Trapped Radiation, Springer-Verlag, 1970.
Sandberg, I., I. A. Daglis, D. Heynderickx, P. Truscott, A. Hands, H. Evans, and P. Nieminen, Development and Validation of the Electron Slot Region Radiation Environment Model, IEEE Trans. Nucl. Sci., 61, 1656-1662, 2014 (doi:10.1109/TNS.2014.2304982).
Sawyer, D. M., and J. I. Vette, AP-8 Trapped Proton Environment for Solar Maximum and Solar Minimum, NSSDC/WDC-A-R&S 76-06, 1976.
Sicard-Piet, A., S. Bourdarie, D. Boscher, and R. H. W. Friedel (2006), A model for the geostationary electron environment: POLE, from 30 keV to 5.2 MeV, IEEE Trans. Nucl. Sci., 53(4), 1844-- 1850, doi:10.1109/ TNS.2006.877878.
Sicard-Piet, A., S. Bourdarie, D. Boscher, R. H. W. Friedel, M. Thomsen, T. Goka, H. Matsumoto, and H. Koshiishi (2008), A new international geostationary electron model: IGE-2006, from 1 keV to 5.2 MeV, Space Weather, 6, S07003, doi:10.1029/2007SW000368.
Vampola, A. L., Thick Dielectric Charging on High-Altitude Spacecraft, J. Electrostatics, 20, 21-30, 1987.
Vampola, A. L., Effects of the March-June 1991 Magnetic Storm Period on Magnetospheric Electrons, in Solar-Terrestrial Predictions-IV, Proceedings of a Workshop at Ottawa, Canada, May 18-22, 1992, Vol. 2, NOAA/SEL, Boulder, CO., pp. 703-711, 1993.
Vampola, A. L., Outer Zone Energetic Electron Environment Update, Final Report of ESA/ESTEC Contract No. , 1996.
Vette, J. I., The AE-8 Trapped Electron Model Environment, NSSDC/WDC-A-R&S 91-24, 1991a.
Vette, J. I., The NASA/National Space Science Data Center Trapped Radiation Environment Model Program (1964-1991), NSSDC/WDC-A-R&S 91-29, 1991b.
Walt, M., Introduction to Geomagnetically Trapped Radiation, University Press, Cambridge, 1994.