Table of contents
1 Introduction
The possibility of overcrowding space in the near Earth environment with
meteoroids and orbiting man-made objects has been recognised as a real problem
which already influcences space missions now and may well become a major aspect
of future space flight in general. An example of direct influence is the
shielding of all manned modules required in the International Space Station
programme.
Proper design of the shielding concept requires the use of analysis tools which
allow detailed risk assessment for given spacecraft, shielding design and
mission. To eliminate approximations and uncertainties, such a prediction tool
has to account fully for three-dimensional geometrical and directional effects.
ESABASE, a multi-disciplinary computer-based tool
for system engineering developed for ESA/ESTEC, includes an enhanced 3D
numerical analysis tool for evaluation of the meteoroid and debris
environments, impact probability and resulting damage effects. The
meteoroid/debris tool implemented in SPENVIS does not
include a full geometrical analysis, but does allow an estimation of the
meteoroid and debris particle fluxes on randomly
oriented surfaces in a user-defined orbit. The resulting fluxes can be fed into
particle/wall interaction models to estimate the number of
punctures over a given time interval.
The environment models describe the particle flux relative to a moving
spacecraft as a function of mass, velocity, direction, altitude and orbital
inclination. For both meteoroids and space debris, the models include
mass-density relations, directional collision velocity distributions and
flux-mass/diameter relations. For meteoroids, flux corrections due to Earth are
considered.
Meteoroid and space debris environments are presented separately because of
their different properties and characteristics. The meteoroid environment
encompasses only particles of natural origin whereas the space debris
environment is man-made. The main differences in both classes of particle
models are:
- the average meteoroid density is lower (e.g.
0.5 g cm-3) than the average space debris density (e.g.
2.8 g cm-3);
- the meteoroid flux is considered as impacting a surface under a viewing
angle of 2pi if Earth shielding effects are ignored, while orbital
debris is assumed to be flying in a plane parallel to the Earth's surface;
- the space debris impact velocity distribution depends on the orbital
inclination and exposed surface orientation;
- for particles of diameter above 1 mm the cumulative orbital debris
flux is far more important than the meteoroid flux, but is lower for smaller
particles.
The meteoroid environment encompasses only particles of natural origin.
Meteoroids can be classified as sporadic (i.e. their number is independent of
the time of the year) and streams, whose number increases by a factor 5 or more
during certain periods of the year. The models consist of:
- mass-density models;
- total average flux-mass models including geometrical corrections due to
Earth;
- definition of stream fluxes and models thereof;
- velocity distributions relative to the Earth.
2.1.1 Mass-density models
As it is not a measured quantity, the density of meteoroids is open to serious
uncertainty. Meteoroids are generally considered to be of cometary and
asteroidal origin.
The meteoroid density of interest here is that of particles which result from
the break-up of cometary nuclei. The cometary meteoroid is described as a
conglomerate of dust particles. values of density calculated from photographic
and radar observations range from 0.16 g cm-3 to
4 g cm-3 [Cour-Palais, 1969].
The values for average mass density quoted in the literature vary widely, so
that a value can only estimated. A value of 0.5 g cm-3
seems the most appropriate for a constant mass density (rho). A more
appropriate mass-density relation is a decreasing and non-continuous function
of mass given by:
| |
2.0 g cm-3
|
for m < 10-6 g
|
|
rho(m) =
|
1.0 g cm-3
|
for 10-6 g <= m <= 10-2 g
|
| |
0.5 g cm-3
|
for m > 10-2 g
|
In SPENVIS, the user has the choice between this relation or
a constant mass density.
2.1.2 The Grün interplanetary flux model
The flux-mass model for meteoroids at 1 AU of Grün et al.
[1985] gives the total average meteoroid flux in terms of the integral flux,
i.e. the number of particles per m2 per year of mass larger than or
equal to a given mass m, impacting a randomly-oriented flat plate under
a viewing angle of 2pi. Except for Earth shielding and gravitational
effects, this flux is omnidirectional.
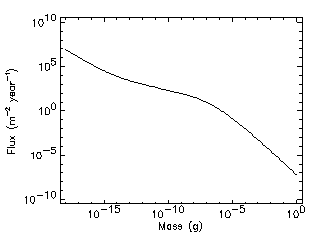
This 'interplanetary' flux covers the range 10-18-1 g. It
closely fits the fluxes from the HEOS 2 and PIONEER 8-9 measurements
and is analytically described as:
F(m) = 3.15576x10⁷
[F1(m) + F2(m) +
F3(m)] ,
where
F1(m) = (2.2x10³ m0.306
+ 15.0)-4.38
F2(m) = 1.3x10⁻⁹ (m +
1011 m2 +
1027 m4)-0.36
F3(m) = 1.3x10⁻¹⁶ (m +
106 m2)-0.85
Function F1(m) refers to large particles (m
> 10-9 g), function F2(m) to
intermediate sized particles (10-14 g < m <
10-9 g) and function F3(m) to small
particles (m < 10-14 g). The Grün et al.
(1985) model is represented in Fig. 1.
|
|
Figure 1. The Grün meteoroid flux-mass model
|
2.1.3 Flux corrections due to Earth
As the Grün model represents the total meteoroid flux at 1 AU from
the Sun in the ecliptic plane, but in the absence of the Earth, two corrections
need to be taken into account, one related to Earth shielding, which reduces
the flux, and one to the gravitational effect of the Earth, which tends to
increase the flux, in order to account for the presence of the Earth.
2.1.3.1 Earth shielding
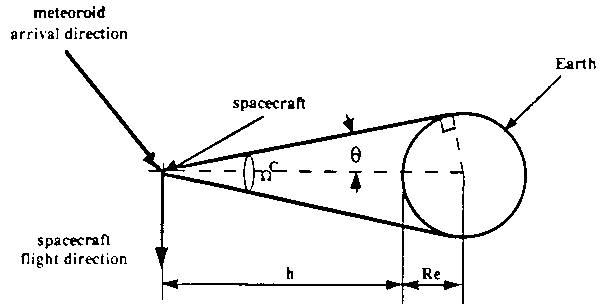
The Earth shielding is accounted for via the geometrical multiplicative factor
xi which depends on the spacecraft altitude. This has the effect of
subtracting the flux within the solid angle subtended by the shielding body,
the Earth shielding cone
(see Fig. 2). If the target plate is assumed to be randomly oriented, an
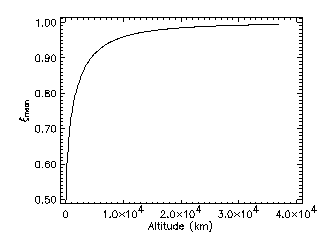
averaged xi factor is considered:
ximean = 0.5 (1 + cos theta)
where theta is defined by
sin theta = (RE + 100) / (RE +
h)
RE being the mean Earth radius (6378 km) and h the
altitude of the target above the Earth's surface in km
(h => 100 km). The constant 100
corresponds to the atmosphere height above the Earth. The dependence of
ximean on altitude is represented in Fig. 3.
|
|
Figure 2. Earth shielding effect for meteoroid flux
|
|
|
Figure 3. Geometrical shielding factor for meteoroid flux
|
2.1.3.2 Gravitational focussing
Due to the gravitational field of the Earth, meteoroid particles are attracted
and therefore the flux increases compared to deep space. This effect is taken
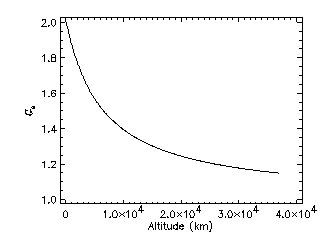
into account by the gravitational focussing factor GE
defined as
GE = 1 + (RE + 100) /
(RE + h)
for the Grün model. Figure 4 shows the graviational focussing
factor as a function of altitude.
|
|
Figure 4. Gravitational focussing factor for meteoroid flux
|
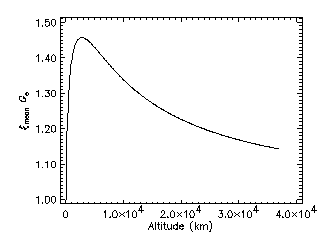
2.1.3.3 Combined correction
Consideration of the Earth shielding and gravitational
focussing gives a particle flux-mass which depends on spacecraft altitude.
This corrected flux Fc is expressed as
Fc(m,h) = F(m)
GE(h) xi(h)
The combined correction factor GE(h)
xi(h) is represented in Fig. 5.
|
|
Figure 5. Total meteoroid flux correction due to Earth
|
2.1.4 Meteoroid stream models
The Grün et al. [1985] meteoroid flux is defined by means of the
cumulative sporadic plus streams flux averaged over one year. In fact,
noticeable increases in the average hourly rate of meteor activity have been
observed at regular intervals during the calendar year. These increases are
caused by the Earth's passage through a stream of particles travelling in
similar heliocentric orbits.
Two models of the annual meteoroid streams are available: the
Cour-Palais [1969] method, and the Jenniskens [1994] method. In
SPENVIS, no stream models are implemented.
2.1.4.1 The Cour-Palais model
The flux-mass model for stream meteoroids has been described by Cour-Palais
[MBB-ERNO, 1988] as:
log Fst = -14.41 - log m - 4
log(vst/20) + log F
where Fst is the number of stream particles of mass m
or larger in units of m-2 s-1, m the particle
mass (g), Fst the geocentric velocity of the stream in
km s-1, and F the integrated ratio of cumulative stream flux
to the average cumulative sporadic flux.
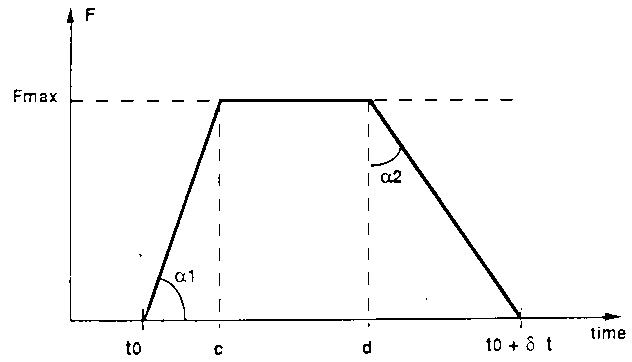
The F function is a piecewise linear function of time that depends on
five parameters:
- the time of occurrence (t0)
- the duration (delta t)
- the maximum flux ratio (Fmax)
- the increase rate (alpha1)
- the decrease rate (alpha2)
Figure 6 shows a schematic representation of the F function. The
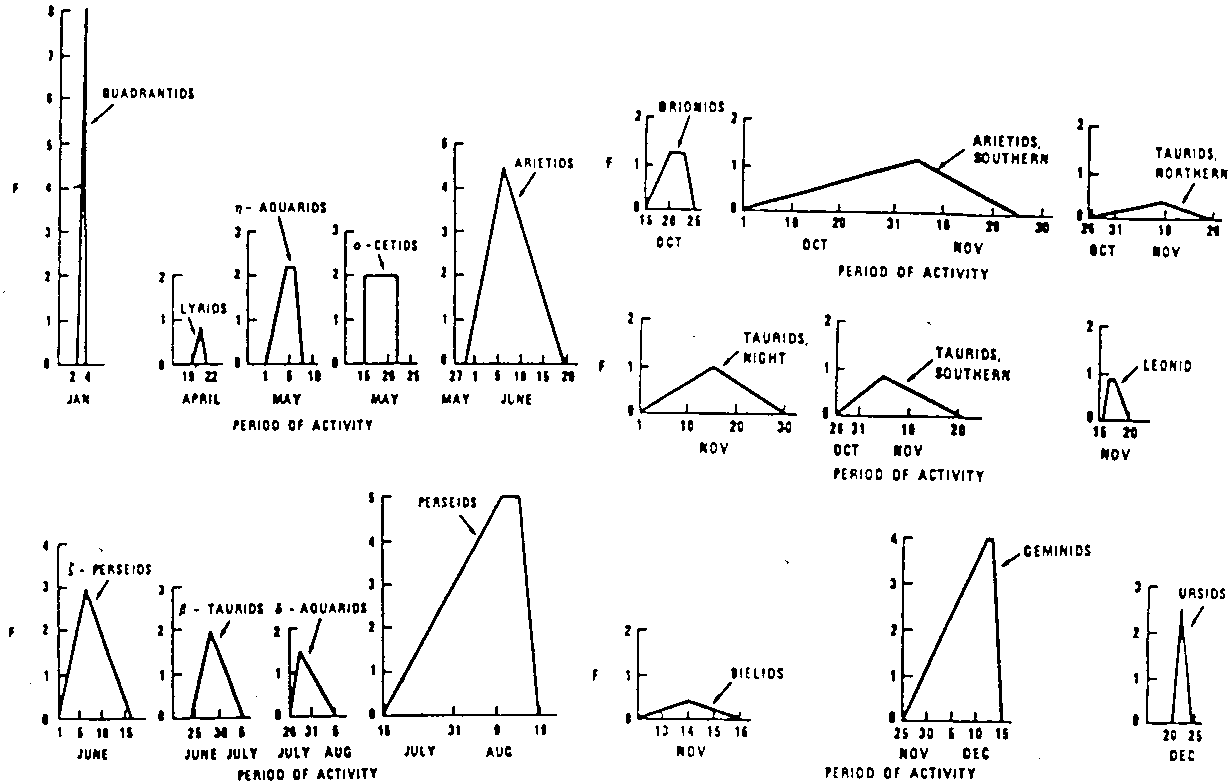
stream parameters for major streams are listed in Table 1. The major
streams are represented graphically in Fig. 7.
|
|
Figure 6. Meteoroid stream flux ratio
|
Table 1. Summary of the Cour-Palais characteristics of major stream
events
| Stream name |
Time of occurence
(day of year) |
Duration
(days) |
Increase rate
(deg) |
Decrease rate
(deg) |
Maximum flux ratio |
Velocity
(km s-1) |
| Quadrantids |
2 |
2 |
82.87 |
7.13 |
8.0 |
42.0 |
| Lyrids |
109 |
3 |
23.03 |
49.64 |
0.85 |
48.0 |
| eta Aquarids |
121 |
7 |
36.25 |
42.27 |
2.2 |
64.0 |
| omicron Cetids |
134 |
9 |
90.0 |
90.0 |
2.0 |
37.0 |
| Arietids |
149 |
21 |
29.36 |
70.91 |
4.5 |
38.0 |
| zeta Perseids |
152 |
15 |
30.96 |
73.30 |
3.0 |
29.0 |
| beta Taurids |
175 |
11 |
26.57 |
74.05 |
2.0 |
31.0 |
| delta Aquarids |
207 |
10 |
36.87 |
79.38 |
1.5 |
40.0 |
| Perseids |
196 |
34 |
10.89 |
38.66 |
5.0 |
60.0 |
| Orionids |
288 |
10 |
11.31 |
39.80 |
1.2 |
66.0 |
| Arietids Southern |
274 |
58 |
3.27 |
85.03 |
2.0 |
28.0 |
| Taurids Northern |
299 |
27 |
1.53 |
88.09 |
0.4 |
29.0 |
| Taurids Night |
305 |
29 |
4.09 |
86.19 |
1.0 |
37.0 |
| Taurids Southern |
299 |
27 |
3.43 |
85.71 |
0.9 |
28.0 |
| Leonids Southern |
319 |
5 |
41.99 |
73.30 |
0.9 |
72.0 |
| Bielids |
316 |
4 |
11.31 |
78.69 |
0.4 |
16.0 |
| Geminids |
329 |
22 |
13.24 |
45.0 |
4.0 |
35.0 |
| Ursids |
354 |
4 |
51.34 |
38.66 |
2.5 |
37.0 |
|
|
Figure 7. The major Cour-Palais meteoroid streams
|
2.1.4.2 The Jenniskens model
The Jenniskens [1994] meteoroid stream model is based on data collected
by a large number of observers over a 10 year period from observation sites in
both the northern and southern hemispheres. The stream geometry and activity at
shower maximum are defined by:
- the solar longitude lambdamax;
- the maximum zenithal hourly rate ZHRmax, which is the number
of 'visible' meteors seen after various observer and location related
corrections have been applied;
- the apparent radiant position in right ascension and declination of the
radiant;
- the geocentric meteoroid speeds, defined as the final geocentric velocity
vinfinity as the meteoroids reach the top of the atmosphere.
The right ascension (RA) and declination (DEC) of the radiant for an
instantaneous values of the solar longitude are given by:
RA(lambda) = RA(lambda0) + DRA (lambda -
lambda0)
and
Dec(lambda) = Dec(lambda0) + DDec (lambda -
lambda0) ,
where DRA and DDec are the variations of RA and Dec per degree of solar
longitude. The shower activity as a function of time around its maximum is
described by:
ZHR = ZHRmax
10-B|lambda-lambdamax| ,
where B describes the slope of the activity profiles. Since most streams
are found to have symmetrical profiles, a single values of B is
sufficient. The Geminids are the exception: this stream needs a different value
of B for the inward and outward slope. Six of the streams do not have a
strong enough ZHR to produce a slope: here it is suggested to use a 'typical'
value B = 0.2. Six other streams are best represented by the
sum of two activity profiles, defined by a peak profile
ZHRpmax and Bp and a background profile
ZHRbmax with separate inward and outward slope values
Bb+ and Bb-, respectively. This results in
the following expression:
ZHR = ZHRpmax
10-Bp|lambda-lambdamax|
+ ZHRbmax
(10-Bb-(lambdamax-lambda)
+ 10-Bb+(lambda-lambdamax))
The cumulative flux at solar longitude lambda can now be expressed
as:
F(m,lambda) = F(m)max
ZHR(lambda) / ZHRmax
with
F(m)max = k m-alpha ,
where F(m) is the cumulative flux (in
m-2 s-1) of particles with mass greater than
m (in kg), alpha is the cumulative mass distribution index, and
k the cumulative mass distribution constant.
The total particle flux Ftot is obtained by summation over
all streams:
Ftot = Fsp + Sum Fst .
Since the Grün flux models all particles, including the streams,
Ftot must be forced to equal the Grün flux when summed
over a full year. Thus, when the stream model is used, the new sporadic flux
becomes:
Fsp = FGrün - Sum
Fst ,
where the sum is evaluated over one full year. Table 2 lists the
parameters of the 50 Jenniskens streams.
Table 2. Parameters of the 50 Jenniskens streams
| Stream name |
lambdamax |
RAmax |
DRA |
Decmax |
DDec |
ZHRpmax |
Bp+ |
Bp- |
ZHRbmax |
Bb+ |
Bb- |
alpha |
k |
vinfinity |
| Bootids |
283.3 |
232 |
0.6 |
45 |
-0.3 |
110.0 |
2.50 |
2.50 |
20.0 |
0.37 |
0.45 |
0.92 |
8.4x10⁻¹⁷ |
43 |
| gamma Velids |
285.7 |
124 |
0.5 |
-47 |
-0.2 |
2.4 |
0.12 |
0.12 |
0.0 |
0.0 |
0.0 |
1.10 |
5.8x10⁻¹⁹ |
35 |
| alpha Crucids |
294.5 |
193 |
1.1 |
-63 |
-0.4 |
3.0 |
0.11 |
0.11 |
0.0 |
0.0 |
0.0 |
1.06 |
1.9x10⁻¹⁹ |
50 |
| alpha Hydrusids |
300.0 |
138 |
0.7 |
-13 |
-0.3 |
2.0 |
0.20 |
0.20 |
0.0 |
0.0 |
0.0 |
1.3 |
3.4x10⁻¹⁹ |
44 |
| alpha Carinids |
311.2 |
99 |
0.4 |
-54 |
0.0 |
2.3 |
0.16 |
0.16 |
0.0 |
0.0 |
0.0 |
0.92 |
1.3x10⁻¹⁷ |
25 |
| delta Velids |
318.0 |
127 |
0.5 |
-50 |
-0.3 |
1.3 |
0.20 |
0.20 |
0.0 |
0.0 |
0.0 |
1.10 |
3.1x10⁻¹⁹ |
35 |
| alpha Centaurids |
319.4 |
210 |
1.3 |
-58 |
-0.3 |
7.3 |
0.18 |
0.18 |
0.0 |
0.0 |
0.0 |
0.83 |
3.7x10⁻¹⁸ |
57 |
| omicron Centaurids |
323.4 |
176 |
0.9 |
-55 |
-0.4 |
2.2 |
0.15 |
0.15 |
0.0 |
0.0 |
0.0 |
1.03 |
1.9x10⁻¹⁹ |
51 |
| theta Centaurids |
334.0 |
220 |
1.1 |
-44 |
-0.4 |
4.5 |
0.20 |
0.20 |
0.0 |
0.0 |
0.0 |
0.95 |
4.4x10⁻¹⁹ |
60 |
| delta Leonids |
335.0 |
169 |
1.0 |
17 |
-0.3 |
1.1 |
0.049 |
0.049 |
0.0 |
0.0 |
0.0 |
1.10 |
1.9x10⁻¹⁸ |
23 |
| Virginids |
340.0 |
165 |
0.9 |
9.0 |
-0.2 |
1.5 |
0.20 |
0.20 |
0.0 |
0.0 |
0.0 |
1.10 |
1.5x10⁻¹⁸ |
26 |
| gamma Normids |
353.0 |
285 |
1.3 |
-56 |
-0.2 |
5.8 |
0.19 |
0.19 |
0.0 |
0.0 |
0.0 |
0.87 |
1.9x10⁻¹⁸ |
56 |
| delta Pavonids |
11.1 |
311 |
1.6 |
-63 |
-0.2 |
5.3 |
0.075 |
0.075 |
0.0 |
0.0 |
0.0 |
0.95 |
5.1x10⁻¹⁹ |
60 |
| Lyrids |
32.4 |
274 |
1.2 |
33 |
0.2 |
12.8 |
0.22 |
0.22 |
0.0 |
0.0 |
0.0 |
0.99 |
2.0x10⁻¹⁸ |
49 |
| mu Virginids |
40.0 |
230 |
0.5 |
-8 |
-0.3 |
2.2 |
0.045 |
0.045 |
0.0 |
0.0 |
0.0 |
1.10 |
1.1x10⁻¹⁸ |
30 |
| eta Aquarids |
46.5 |
340 |
0.9 |
-1 |
0.3 |
36.7 |
0.08 |
0.08 |
0.0 |
0.0 |
0.0 |
0.99 |
1.5x10⁻¹⁸ |
66 |
| beta Corona Australids |
56.0 |
284 |
1.3 |
-40 |
0.1 |
3.0 |
0.20 |
0.20 |
0.0 |
0.0 |
0.0 |
1.13 |
1.5x10⁻¹⁹ |
45 |
| alpha Scorpiids |
55.9 |
252 |
1.1 |
-27 |
-0.2 |
3.2 |
0.13 |
0.13 |
0.0 |
0.0 |
0.0 |
0.92 |
4.7x10⁻¹⁷ |
21 |
| Da. Arietids |
77.0 |
47 |
0.7 |
24 |
0.6 |
54.0 |
0.10 |
0.10 |
0.0 |
0.0 |
0.0 |
0.99 |
2.6x10⁻¹⁷ |
38 |
| gamma Sagittarids |
89.2 |
286 |
1.1 |
-25 |
0.1 |
2.4 |
0.037 |
0.037 |
0.0 |
0.0 |
0.0 |
1.06 |
1.9x10⁻¹⁸ |
29 |
| tau Cetids |
95.7 |
24 |
0.9 |
-12 |
0.4 |
3.6 |
0.18 |
0.18 |
0.0 |
0.0 |
0.0 |
0.92 |
3.7x10⁻¹⁹ |
6.6 |
| theta Ophiuchids |
98.0 |
292 |
1.1 |
-11 |
0.1 |
2.3 |
0.037 |
0.037 |
0.0 |
0.0 |
0.0 |
1.03 |
3.5x10⁻¹⁸ |
27 |
| tau Aquarids |
98.0 |
342 |
1.0 |
-12 |
0.4 |
7.1 |
0.24 |
0.24 |
0.0 |
0.0 |
0.0 |
0.92 |
8.9x10⁻¹⁹ |
63 |
| nu Phoenicids |
111.2 |
28 |
1.0 |
-40 |
0.5 |
5.0 |
0.25 |
0.25 |
0.0 |
0.0 |
0.0 |
1.10 |
2.6x10⁻¹⁹ |
48 |
| omicron Cygnids |
116.7 |
305 |
0.6 |
47 |
0.2 |
2.5 |
0.13 |
0.13 |
0.0 |
0.0 |
0.0 |
0.99 |
1.4x10⁻¹⁸ |
37 |
| Capricornids |
122.4 |
302 |
0.9 |
-10 |
0.3 |
2.2 |
0.041 |
0.041 |
0.0 |
0.0 |
0.0 |
0.69 |
8.3x10⁻¹⁷ |
25 |
| tau Aquarids North |
124.1 |
324 |
1.0 |
-8 |
0.2 |
1.0 |
0.063 |
0.063 |
0.0 |
0.0 |
0.0 |
1.19 |
3.6x10⁻²⁰ |
42 |
| Pisces Australes |
124.4 |
339 |
1.0 |
-33 |
0.4 |
2.0 |
0.40 |
0.40 |
0.9 |
0.03 |
0.10 |
1.16 |
1.5x10⁻¹⁹ |
42 |
| delta Aquarids Southern |
125.6 |
340 |
0.8 |
-17 |
0.2 |
11.4 |
0.091 |
0.091 |
0.0 |
0.0 |
0.0 |
1.19 |
3.6x10⁻¹⁹ |
43 |
| iota Aquarids Southern |
131.7 |
335 |
1.0 |
-15 |
0.3 |
1.5 |
0.07 |
0.07 |
0.0 |
0.0 |
0.0 |
1.19 |
1.2x10⁻¹⁹ |
36 |
| Perseids |
140.2 |
47 |
1.3 |
58 |
0.1 |
70.0 |
0.35 |
0.35 |
23.0 |
0.05 |
0.092 |
0.92 |
1.2x10⁻¹⁷ |
61 |
| kappa Cygnids |
146.7 |
290 |
0.6 |
52 |
0.3 |
2.3 |
0.069 |
0.069 |
0.0 |
0.0 |
0.0 |
0.79 |
3.0x10⁻¹⁷ |
27 |
| pi Eridanids |
153.0 |
51 |
0.8 |
-16 |
0.3 |
40.0 |
0.20 |
0.20 |
0.0 |
0.0 |
0.0 |
1.03 |
1.7x10⁻¹⁸ |
59 |
| gamma Doradids |
155.7 |
60 |
0.5 |
-50 |
0.0 |
4.8 |
0.18 |
0.18 |
0.0 |
0.0 |
0.0 |
1.03 |
1.1x10⁻¹⁸ |
41 |
| Aurigids |
158.2 |
73 |
1.0 |
43 |
0.2 |
9.0 |
0.19 |
0.19 |
0.0 |
0.0 |
0.0 |
0.99 |
2.9x10⁻¹⁹ |
69 |
| kappa Aquarids |
177.2 |
339 |
0.9 |
-5 |
0.4 |
2.7 |
0.11 |
0.11 |
0.0 |
0.0 |
0.0 |
1.03 |
1.9x10⁻¹⁷ |
19 |
| epsilon Geminids |
206.7 |
104 |
0.7 |
28 |
0.1 |
2.9 |
0.082 |
0.082 |
0.0 |
0.0 |
0.0 |
1.10 |
2.1x10⁻²⁰ |
71 |
| Orionids |
208.6 |
96 |
0.7 |
16 |
0.1 |
25 |
0.12 |
0.12 |
0.0 |
0.0 |
0.0 |
1.13 |
1.6x10⁻¹⁹ |
67 |
| Leo Minorids |
209.7 |
161 |
1.0 |
38 |
-0.4 |
1.9 |
0.14 |
0.14 |
0.0 |
0.0 |
0.0 |
0.99 |
1.1x10⁻¹⁹ |
61 |
| Taurids |
223.6 |
50 |
0.3 |
18 |
0.1 |
7.3 |
0.026 |
0.026 |
0.0 |
0.0 |
0.0 |
0.83 |
4.3x10⁻¹⁷ |
30 |
| delta Eridanids |
229.0 |
54 |
0.9 |
-2 |
0.2 |
0.9 |
0.20 |
0.20 |
0.0 |
0.0 |
0.0 |
1.03 |
7.5x10⁻¹⁹ |
31 |
| zeta Puppids |
232.2 |
117 |
0.7 |
-42 |
-0.2 |
3.2 |
0.13 |
0.13 |
0.0 |
0.0 |
0.0 |
1.22 |
9.5x10⁻²⁰ |
41 |
| Leonids |
235.1 |
154 |
1.0 |
22 |
0.4 |
19.0 |
0.55 |
0.55 |
4.0 |
0.025 |
0.15 |
1.22 |
3.4x10⁻²⁰ |
71 |
| Puppids/Vel |
252.0 |
128 |
0.8 |
-42 |
-0.4 |
4.5 |
0.034 |
0.034 |
0.0 |
0.0 |
0.0 |
1.06 |
8.2x10⁻¹⁹ |
40 |
| Phoenicids |
252.4 |
19 |
0.8 |
-58 |
0.4 |
2.8 |
0.30 |
0.30 |
0.0 |
0.0 |
0.0 |
1.03 |
2.5x10⁻¹⁷ |
18 |
| Monocerotids |
260.9 |
100 |
1.0 |
14 |
-0.1 |
2.0 |
0.25 |
0.25 |
0.0 |
0.0 |
0.0 |
1.25 |
3.3x10⁻²⁰ |
43 |
| Geminids |
262.1 |
113 |
1.0 |
32 |
0.1 |
74.0 |
0.59 |
0.81 |
18.0 |
0.09 |
0.31 |
0.95 |
7.8x10⁻¹⁷ |
36 |
| sigma Hydrusids |
265.5 |
133 |
0.9 |
0 |
-0.3 |
2.5 |
0.1 |
0.1 |
0.0 |
0.0 |
0.0 |
1.10 |
4.7x10⁻²⁰ |
59 |
| Ursids |
271.0 |
224 |
-0.2 |
78 |
-0.3 |
10.0 |
0.90 |
0.90 |
2.0 |
0.08 |
0.2 |
1.22 |
8.1x10⁻¹⁹ |
35 |
McBride and McDonnell [1996] have shown that actually very little is
known about how the Grün flux should be modified to include an apex
enhancement, to sort out the beta meteoroids, and to include
interstellar dust.
2.1.5.1 Separation of alpha and beta source
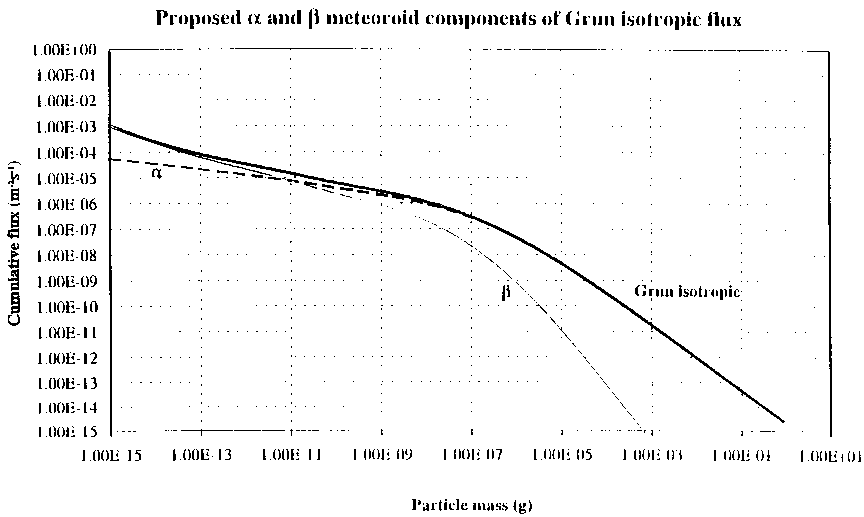
McBride and McDonnell [1996] suggest to separate the Grün flux into
an alpha population and a beta population which has a crossover
at 10-11 g. The beta population has the direction from
the Sun and is of the small particle size. The separation into alpha
flux and beta flux then is given by:
Fbeta(m) = FGrün(m) -
Falpha(m) ,
with
Falpha(m) = FGrün(m)
FH(m) / [FGrün(m) +
FH(m)]
and
log FH(m) = -0.146 log m - 6.427 .
With the above equations it is possible to calculate for each mass the
corresponding cumulative fluxes Falpha and
Fbeta from the Grün flux FGrün.
Figure 8 shows the separation of the Grün flux into alpha and
beta components.
The velocity of the beta particles is size dependent:
v(m) = v0 (1011
m)-gamma ,
with v0 = 20 km s-1 and
gamma = 0.18.
|
|
Figure 8. alpha And beta components of the Grün
isotropic meteoroid flux
|
2.1.5.2 Apex enhancement of the alpha source
McBride and McDonnell [1996] use a minimum to maximum antapex to apex
flux ratio RF (which is in fact unknown) to define a
modulation of the flux and of the velocity about the apex direction. The
angular deviation from the apex direction is denoted by t, and it is
assumed that a parameter delta describes a slight deviation from the
measured peak value which was observed to be about 10° off the apex
direction. Thus, the modulation of the alpha flux and velocity can be
defined as:
Falpha(t) = F0alpha
[1 + DeltaF cos(t+delta)]
valpha(t) = v0alpha
[1 + Deltav cos(t+delta)] ,
where
DeltaF = (RF - 1) /
(RF + 1) ,
Deltav = (vA - vAA) /
(vA + vAA) ,
v0alpha = (vA +
vAA) / 2 ,
and the subscripts A and AA denote apex and antapex, respectively.
From the AMOR meteor data there are some guesses for the maximum to minimum
detectrion ratio from which one may try to obtain values for
RF and vAA. Although RF
could be anywhere in the range 1 to 5 and vA and
vAA are not known either, it is recommended to use the
following values for a first guess:
vA = 17.7 km s-1,
vAA = 8.3 km s-1,
RF = 2, resulting in the values
DeltaF = 0.33 and
Deltav = 0.36.
2.1.5.3 Interstellar dust
McBride and McDonnell [1996] have identified two components of
interstellar dust.
The first source concerns measurements on Ulysses and Galileo, which detected
at about 5 AU particles of 3x10-16 g with heliocentric
velocities of 26 km s-1, ecliptic longitude 252° and
latitude 2.5°. The total particle flux at 1 AU is estimated to be
5x10⁻⁴ m-2 s-1 and the heliocentric
velocity 47 km s-1.
The second source [Taylor et al., 1996] stems from AMOR meteor data
which indicate at least two sources, defined by:
- radiant direction: ecliptic longitude and latitude 243° and 50°,
vinfinity = 40 km s-1;
- radiant direction: ecliptic longitude and latitude 347° and 60°,
vinfinity = 80 km s-1;
The mass of these interstellar meteoroids is estimated to lie between 15 and
40 ??. No flux is known for these contributions.
2.1.6 Velocity distributions
Three velocity density distributions, relative to the Earth, are available in
the literature: the first one has been defined by Cour-Palais [1969], the
second one is part of the NASA90 model Anderson [1991], and the third
is due to Taylor [1995].
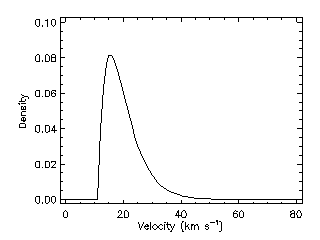
2.1.6.1 The Cour-Palais distribution
In the Cour-Palais model, the velocity v ranges from 11 to 72
km s-1 with a mean value of 20 km s-1. The
Cour-Palais velocity density distribution, originally defined in histogram
form, can be smoothed by a function g (in km s-1) with a
mean value 20 km s-1 and normalised over the velocity
interval from 0 to infinity:
|
g(v) =
|
|
4/81 (v - 11) exp[-2/9 (v-11)]
|
for v > 11
|
|
0
|
for v <= 11
|
|
The Cour-Palais velocity density distribution is represented in Fig. 9.
|
|
Figure 9. Cour-Palais meteoroid velocity density
|
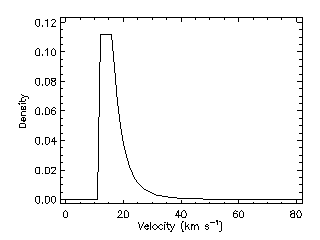
2.1.6.2 The NASA90 distribution
In the NASA90 model, the velocity v ranges from 11.1 to 72.2
km s-1 with a mean value of 17 km s-1. The
NASA90 velocity density distribution is defined as
|
g(v) =
|
|
0.112
|
for 11.1 <= v < 16.3
|
|
3.328x10⁵ v-5.34
|
for 16.3 <= v < 55
|
|
1.695x10⁻⁴
|
for 55 <= v <= 72.2
|
|
The NASA90 velocity density distribution is represented in Fig. 10.
|
|
Figure 10. NASA90 meteoroid velocity density
|
2.1.6.3 The Taylor distribution
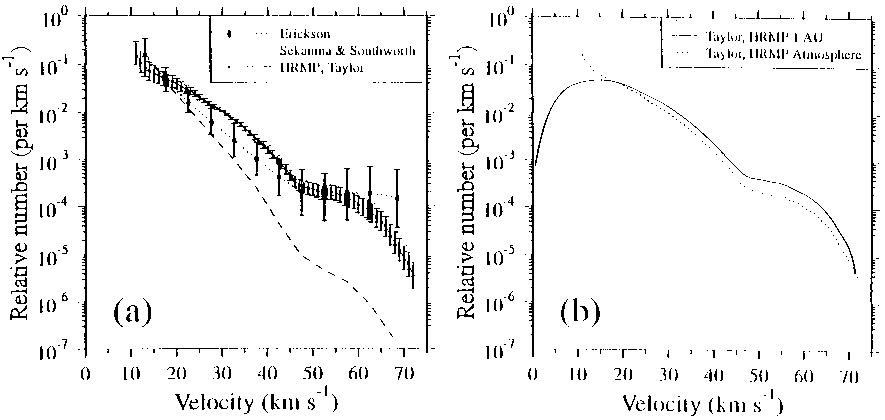
The velocity distributions of meteoroids at 1 AU (i.e. as viewed from a
massless Earth) have generally been derived from ground based observations of
photographic meteors, which are corrected for the effect of the Earth gravity.
McBride and McDonnell [1996] have compared distributions by Erickson,
Sekania and Southworth and by Taylor. They concluded that the most
statistically reliable published data set comes from the Harvard Radio Meteor
Project (HRMP) in which about 20,000 meteor observations were evaluated.
Taylor [1995] re-evaluated and corrected the original measurement data
and derived the normalised distribution shown in Fig. 11.
|
|
Figure 11. Taylor meteoroid velocity density
|
In contrast to the meteoroid environment, the space debris environment is man
made. It consists of inactive satellites or spacecraft, non-operational
payloads and fragments from separation or deployment procedures, accidental
rocket explosions or anti-satellite tests. The orbital debris environment is
more hazardous to space flight than the meteoroid environment below
2,000 km.
Kessler established that the total mass of space debris below
2,000 km is far larger than the meteoroid material. Most of the debris
particles are in high inclination orbits with an average speed of
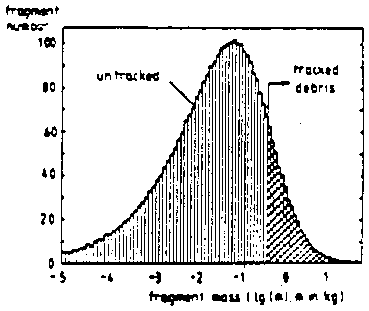
10 km s-1. Figure 12 shows the predicted mass
distribution of space debris resulting from an upperstage explosion.
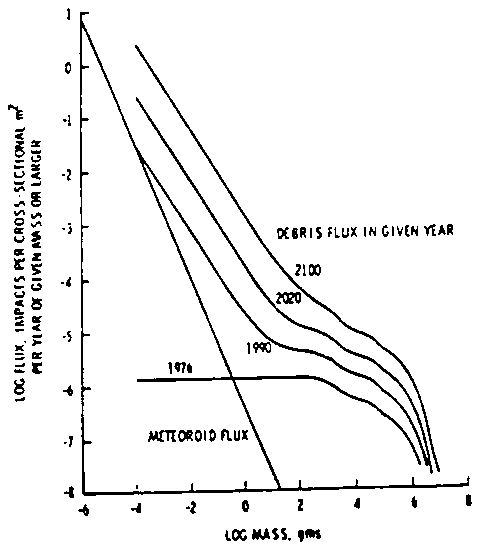
Figure 13 shows the average flux as a function of mass between 700 and
1,200 km for different years. It is estimated that the amount of mass with
diameter 1 cm and smaller will increase at a rate of 2 to 10% per year.
This effect is accounted for in the debris models.
|
|
Figure 12. Predicted mass distribution of space debris resulting from an
upperstage explosion
|
|
|
Figure 13. Average debris flux between 700 and 1,200 km for
different years
|
The description of the space debris environment is useful for low Earth orbit,
because a large portion of the debris population has small sizes. For
geostationary orbits, which are relevant for telecommunication satellites, a
different approach is used. A sufficiently large portion of objects are tracked
individually (e.g. by NORAD). From this data base, a collision probability is
derived using statistical methods [McCormick, 1986; Hechler,
1985]. Nevertheless, small sized objects, which cannot be tracked, lead to
uncertainties and increases in the collison probability.
Due to their origin, space debris particles have the following properties:
- the flight direction is nearly parallel to the Earth's surface;
- the flux depends on spacecraft altitude and orbital inclination;
- the impact velocity is a function of the orbital inclination; specific
directions exist from which most of the debris particles impact;
- the debris environment is evolving with time.
Most debris is in circular orbits.
Three space debris environment models are described below:
- the NASA90 model [Anderson, 1991];
- the ORDEM96 model,
also referenced as the NASA96 model [Kessler et al., 1996];
- the MASTER model [Sdunnus, 1995].
2.2.1 The NASA90 model
The NASA90 debris model is an analytical formulation of the flux vs. particle
diameter. The orbit altitude, epoch and inclination are used in the
formulation. The main input parameter is the particle diameter. The increase of
space debris is accounted for by user defined growth rates. The flux
formulation computes the impact flux on a random tumbling plate.
2.2.1.1 The NASA90 flux model
The flux F, which is the cumulative number of impacts on a spacecraft in
circular orbit per m2 and per year on a randomly tumbling surface,
is defined as a function of the minimum debris diameter d (in cm), the
target orbit altitude h (in km, with h<=2,000 km), the
target orbit inclination i (in degrees), the mission date t (in
years), the 13 month average
solar radio flux
S (in 104 Jy) measured in the year prior to the mission,
the annual growth rate p of mass in orbit (default 0.05), and the growth
rate q of fragment mass (default: 0.02 before 2011, 0.04 after
2011):
F(d,h,i,t,S) = H(d) Phi(h,S)
Psi(i)
[F1(d) g1(t,p) +
F2(d) g2(t,p)] ,
with
H(d) = 100.5 exp[-(log d - 0.78)2 /
0.406]
Phi(h,S) = Phi1(h,S) /
[1 + Phi1(h,S)]
Phi1(h,S) = 10h/200 - S/140 -
1.5
F1(d) = 1.22x10⁻⁵
d-2.5
F2(d) = 8.1x10¹⁰
(d + 700)-6
g1(t,q) = (1 + q)t-1988
g2(t,p) = 1 + p (t-1988)
The function Psi(i) defines the relationship between the flux on
a spacecraft in an orbit of inclination i and the flux incident on a
spacecraft in the current population's average inclination of about 60°.
Psi(i) is tabulated in Table 3; for intermediate values of
i, a linear interpolation is performed.
Table 3. NASA90 Inclination dependent function Psi
| i (deg) |
Psi(i) |
| <=28.5 | 0.91 |
| 30 | 0.92 |
| 40 | 0.96 |
| 50 | 1.02 |
| 60 | 1.09 |
| 70 | 1.26 |
| 80 | 1.71 |
| 90 | 1.37 |
| 100 | 1.78 |
| =>120 | 1.18 |
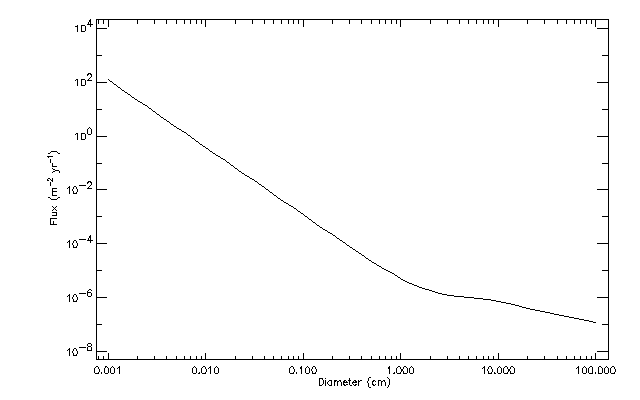
Figure 14 shows the NASA90 flux model for altitude 400 km and
inclination 51.6°.
|
|
Figure 14. NASA90 Flux for altitude 400 km and inclination 51.6°
|
2.2.1.2 The NASA90 velocity distribution
The collision velocity distribution g(v,i,h), i.e. the number of
impacts with velocity between v and v+dv, relative to a
moving spacecraft with orbital inclination i and altitude h, is
given by:
|
g(v,i,h) =
|
v [2v0(i,h) - v] {
|
g1(i) exp{-[(v -
2.5v0(i,h)) /
(g2(i)
v0(i,h))]2}
|
|
|
+ g3(i) exp{-[(v -
g4(i) v0(i,h)) /
(g5(i)
v0(i,h))]2} }
|
|
+ g6(i) v
[4v0(i,h) - v] ,
|
where the functions gj(i) and
v0(i,h) are piecewise polynomials defined as:
|
g1(i) =
|
| 18.7 |
|
i < 60°
|
|
18.7 + 0.0298 (i - 60)3
|
|
60° <= i < 80°
|
| 250 |
|
i => 80°
|
|
| |
|
g2(i) =
|
| 0.5 |
|
i < 60°
|
|
0.5 - 0.01 (i - 60)
|
|
60° <= i < 80°
|
| 0.3 |
|
i => 80°
|
|
| |
|
g3(i) =
|
| 0.3 + 0.0008 (i - 50)2 |
|
i < 50°
|
|
0.3 - 0.01 (i - 50)
|
|
50° <= i < 80°
|
| 0 |
|
i => 80°
|
|
| |
|
g4(i) =
|
1.3 - 0.01 (i - 30)
|
| |
|
g5(i) =
|
0.55 + 0.005 (i - 30)
|
| |
|
g6(i) =
|
|
0.0125 [1 - 0.0000757 (i - 60)2]
|
|
i < 100°
|
|
[0.0125 + 0.00125 (i - 100)]
[1 - 0.0000757 (i - 60)2]
|
|
i => 100°
|
|
| |
|
v0(i,h) =
|
|
v0(h) [7.25 + 0.015 (i - 30)] / 7.7
|
|
i < 60°
|
|
v0(h)
|
|
i => 60°
|
|
and v0(h) is the velocity at target orbit altitude
h:
v0(h) = 631.7 (6378 + h)-0.5
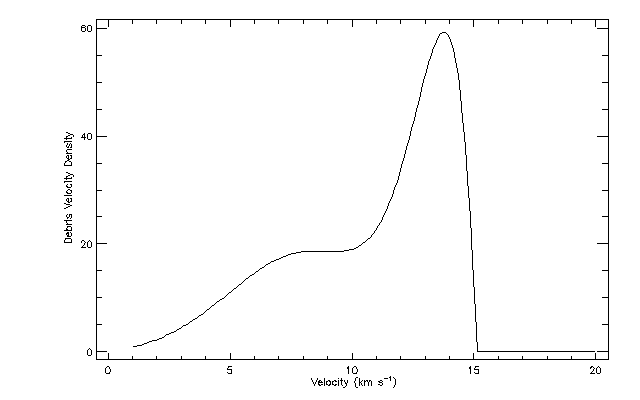
Figure 15 shows the NASA90 velocity distribution for altitude 400 km
and inclination 51.6°.
|
|
Figure 15. NASA90 Velocity distribution for altitude 400 km and
inclination 51.6°
|
2.2.1.3 The NASA90 mass density model
For the NASA90 model the particle mass density rho can be either set to
a constant with default value 2.8 g cm-3 or the following
relation can be used:
|
rho(d) =
|
|
2.8 d-0.74
|
d => 0.62 |
|
4.0
|
d < 0.62 |
|
where d is the particle diameter (in cm).
2.2.3 The NASA96 model
The Johsnon Space Centre [Kessler et al., 1996] has
published
a new engineering model, ORDEM96, which constitutes an update to the NASA90
model. It will be referenced as the NASA96 model. This model is based on
various empirical considerations and basically defines orbits in six different
inclination domains. For each orbit, a numerical collision analysis needs to be
made, which yields a spatial debris density around the target orbiter together
with directional information, which leads to debris fluxes on the specific
target orbit. Unlike the NASA90 model, the NASA96 model does not directly
define fluxes but defines numbers of orbits of various contribution types which
first need to be numerically converted to fluxes.
2.2.3.1 General description
In the NASA90 model, the debris fluxes and the velocity distributions are
defined by empirical functions which depend on debris diameter, altitude,
epoch, and inclination. In the NASA96 model it is no longer possible to express
the flux and velocity distributions explicitly as a function of orbital
elements.
Due to more refined measurement data, primarily produced by Haystack radar and
LDEF, it became necessary for the NASA96 model to define debris orbit numbers
of circular and elliptical type with given particle size, altitude, and perigee
altitude distributions, for six inclination ranges. With this orbit information
it is then possible to conduct a numerical collison analysis which yields the
flux on a given target orbit by calculating the spatial debris densitites along
the target orbit.
In addition to circular orbits, eccentric debris orbits are now included. Thus,
impact directions with non vanishing elevations are obtained. The circular
orbit family represents debris orbits with eccentricity e < 0.2,
while the eccentric orbit family represents debris orbits with eccentricity
e > 0.2. The apogee of the elliptic orbits is fixed at
20,000 km, but the perigee altitudes vary.
Six source components are used, in decreasing size:
- intact objects (d > 20 cm);
- large fragments (1 cm < d <= 20 cm);
- small fragments and Na/K particles (200x10-6 m < d <= 1 cm);
- paint flakes (20x10-6 m < d <= 200x10-6 m);
- Al2O3 micron particles (d < 20x10-6 m).
These size ranges only indicate the dominating contributions, i.e. the various
debris sources also contribute outside the indicated ranges.
The functional forms used to represent the number of particles consist of 12
sets of equations, which correspond to the six inclination bands with each a
set of circular and elliptical orbits, and with the following functional
dependencies of the particle sizes:
- circular orbits: function of altitude, particle size, mission time, solar
activity;
- elliptical orbits: function of perigee altitude, particle size, mission
time.
2.2.3.2 Definition of the debris orbit distributions
Circular and eccentric orbits are defined in the following six inclination
ranges (the numbers in brackets are the central values):
0° <= i < 19° (7°),
19° <= i < 36° (28°),
36° <= i < 61° (51°),
61° <= i < 73° (65°),
73° <= i < 91° (82°),
91° <= i < 180° (98°).
The eccentric orbits all have the same apogee altitude of 20,000 km.
The general forms of the equations for the number of debris objects within an
altitude or perigee altitude bin of 1 km width, for a particular
inclination range, are:
Nc = 0.1 g(t) [
phii(h,s) Fi(d) +
phif(h,s) Ff(d) +
phis(h,d,s) Fs(d) +
phip(h) Fp(d) +
phim(h,s) Fm(d) ]
for circular orbits, and
Ne = g(t) [
phii(q) Fi(d) +
phif(q) Ff(d) +
phis(q) Fs(d) +
phip(q) Fp(d) +
phim(q) Fm(d) ]
for elliptical orbits, where h is the circular orbit altitude and
q the eccentric orbit perigee altitude, s is the solar activity
F10.7
in the year prior to the mission, and the indices refer
to the size ranges defined above. The growth factor g(t) is
defined as:
g(t) = 1 + g0 (t - 1995) ,
with g0 between 0.04 and 0.08 and t the mission time
in calendar year. Some of the phii and phif
functions further depend on the production rate of new debris to the historical
rate, which takes values between 0.2 and 1.0. The functions phi are sums
of rational functions of exponential functions with exponents that are linear
functions of h or q. The factors F are rational functions
of powers of d.
2.2.3.3 Numerical collision analysis
Kessler et al. [1996]
suggest to determine the flux on a given target orbit as a function of debris
diameter and the azimut and elevation in 1 km bins of altitude or perigee
altitude by performing a numerical collison analysis based on the calculation
of spatial densities.
2.2.3.4 Limitations of the NASA96 model
The NASA96 model is essentially limited to low Earth and nearly circular target
orbits. It does not, for instance, predict a collison probability along
geostationary orbits or on geostationary transfer orbits, except for the near
perigee region.
The collision analysis implies that fluxes are averaged over one orbital
revolution of the spacecraft, so that no flux variations along the orbital path
are seen. In addition, one must be aware that the collison analysis uses
spatial densities which are functions of the distance and latitude only,
because the flux is averaged over the argument of perigee and over the right
ascension of the ascending node.
Only two eccentricity families are considered in the NASA96 model. Debris
orbits of eccentricity lower than 0.2 are represented by circular orbit part,
while debris orbits with eccentricities above 0.2 are represented by elliptical
orbits with fixed apogee height of 20,000 km. Thus, the circular orbit
part does not give any contributions on the top and bottom surface impacts by
orbits in the eccentricity range 0.0-0.2. For higher eccentricities it is
possible to obtain impact probabillities on these surfaces, but one must be
aware that this does not represent the full contribution.
Molniya type heliosynchronous orbis, with their considerable contributions of
delta upper stae explosion event debris, are not yet included in the NASA96
model. However, for target orbiters with inclinations lower than 63° this
is of no concern.
2.2.4 The MASTER model
Initiated via an ESA contract [Sdunnus, 1995], a numerical data base
MASTER was established. Fragmentation models have been applied to all known
(127 as of 1996) break-up events. This resulted in a total of about
1011 objects above 100x10-6 m in size, which was
reduced by sampling techniques to about 250,000 objects. Together with the
trackable population, which is represented by the two line element data set,
the orbits of these objects are propagated to a reference epoch. The resulting
spatial density is stored in bins at the reference epoch. Sophisticated data
compression techniques are employed to store the large amount of data.
The MASTER lower mass threshold is 0.1 mm. The altitude ranges from low
Earth orbit (186 km) to geostationary altitude (35,800 km). The
MASTER data base is available on CD-ROM and is regularly updated.
MASTER 2005
This version is recommended by ECSS standards.
MASTER 2009
A new enhanced MASTER model has been developed and was released in 2009.
Simulation of the space debris environment in the new ESA's MASTER Model (Meteoroid and Space Debris
Environment Reference) is performed through modelling of the physical generation processes for the
different sources. The following sources of debris are considered: launch and mission-related objects,
explosion and collision fragments, solid rocket motor slag and dust, NaK droplets, surface degradation products,
ejecta, and meteoroids. MASTER can deliver flux and spatial density analysis for all epochs between 1957 and 2060.
For all epochs, the lower size threshold is one micron. The analysis of the future debris environment (after 2009)
is possible based on three different future scenarios (business as usual, intermediate mitigation, full mitigation).
3 Particle/wall interaction models
For the micro-particle environment risk analysis, the interaction of the
particles with the spacecraft structures is as important as the evaluation of
the particle fluxes. For this purpose, so-called damage equations, describing
the physical phenomena of a particle impacting a structure at very high
velocities, are used. The typical impact velocity for space debris is 8 to
10 km s-1, for meteoroids about
20 km s-1.
Due to the very complex physics of the impact phenomena, e.g. melting or
shattering of the impactor, the equations are derived from experiments using
empirical formulae. Lately, hydro-codes have been used to simulate
hypervelocity impacts. However, due to the huge requirements in computation
power and the delicate operation of these codes, they have not yet become
standard for this type of phenomena.
The damage equations are treated in two separate groups:
- The ballistic limit equations, which yield the critical impacting
particle size above which the structure fails. Different equations are used for
single and multiple wall structures. Different criteria are used to define the
failure, ranging from spallation of the target to effective penetration.
- The damage size equations, which yield the crater size of semi-infinite
targets and the hole diameter of punctured targets (generally thin walls).
Four classes of damage equations are described below:
- the single wall ballistic limit equation;
- the multiple wall ballistic limit equation;
- the crater size equation;
- the clear hole equation.
Use of the damage equations needs information on the target design. Two designs
are considered:
- The single wall. This is a normal homogeneous structural wall,
characterised by its thickness and its material density. Generally, the
parameters of the equations are scaled with the density or strength of the
target material between test targets and analysed targets.
- The multiple wall. This design characterises structures provided
with special protection. The most efficient way to protect a structure from
failur is the use of one or more thin shielding layers in front of the
structural wall (referred to as the back-up wall).
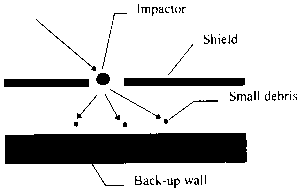 The first wall is penetrated by the impacting particle, but this primary impact
shatters the impactor into a cloud of small debris particles which may be
solid, liquid or vaporised, and which are less harmful to the back-up wall than
one single particle. The multiple wall design is characterised by the material
densities and thicknesses of back-up wall and shield, as well as the spacing
between shield and back-up wall. For multiple walls composed of several
shielding layers, the analyis uses the summed thickness of the shields and the
averaged spacing for the equation formula. A typical case is when a specific
micro-particle shielding or thermal protection (MLI) is applied to the basic
structure. Due to the increasing concern of the risk posed by the
micro-particle environment of long term missions (above all the international
space station), special micro-particle shields have been developed.
3.1 The damage equations
In order to provide the necessary flexibility in the usage of currently
available and possible future damage equation formulations, the five classes of
damage equations have been formulated in a parametric form, allowing the user
to adapt the equation to his needs. The parameters for the standard equations
are listed with each equation class.
The ballistic limit equations are used to compute the critical particle
diameter, and the damage size equations to compute the crater or hole diameter.
The symbols used in the equations are listed in Table 4.
Table 4. General symbols for the damage equations
| Symbol |
Units |
Description |
| tt, tb, ts |
cm |
Thickness of target, back-up wall, shield |
| K |
|
Characteristic factor |
| dp |
cm |
Particle (impactor) diameter |
| rhot, rhop, rhos,
rhob |
g cm-3 |
Density of target, particle, shield, back-up wall |
| v |
km s-1 |
Impact velocity |
| alpha |
|
Impact angle |
| S |
cm |
Spacing between shielding and back-up wall |
| D |
cm |
Crater or hole diameter |
3.1.1 The single wall ballistic limit equation
The parametric formulation of the single wall ballistic limit equation
is:
dp,lim = { tt / [Kf
K1 rhopbeta
vgamma cosxialpha
rhotkappa] }1/lambda
The Kf factor allow to specify what type of damage is
considered a failure for the thick plate equation and the glass target
equations. In the other equations, it is not used. The K1
factor includes other parameters particular to each equation (e.g. target yield
strength sigmat). The values of the parameters for the
standard equations are given in Table 5.
Table 5. Standard parameter values for the single wall ballistic limit
equation
| Equation |
Kf (1) |
K1 (2) |
lambda |
beta |
gamma |
xi |
kappa |
| Thick plate |
1.8-3 |
0.2-0.33 |
1.056 |
0.519 |
2/3 |
2/3 |
0 |
| Thin plate |
1.0 |
0.26-0.64 |
1.056 |
0.519 |
0.875 |
0.875 |
0 |
| MLI (3) |
1.0 |
0.37 |
1.056 |
0.519 |
0.875 |
0.875 |
0 |
| Pailer-Grün |
1.0 |
0.77 |
1.212 |
0.737 |
0.875 |
0.875 |
-0.5 |
| McDonnell & Sullivan |
1.0 |
0.756 [sigmaAl / sigmat]0.134 |
1.056 |
0.476 |
0.806 |
0.806 |
-0.476 |
| Gardner |
1.0 |
0.608 sigmat-0.093 |
1.059 |
0.686 |
0.976 |
0.976 |
-0.343 |
| Gardner, McDonnell, Collier |
1.0 |
0.85 sigmat-0.153 |
1.056 |
0.763 |
0.763 |
0.763 |
-0.382 |
| Frost |
1.0 |
0.43 |
1.056 |
0.519 |
0.875 |
0.875 |
0 |
| Naumann, Jex, Johnson |
1.0 |
0.65 |
1.056 |
0.5 |
0.875 |
0.875 |
-0.5 |
| Naumann |
1.0 |
0.326 |
1.056 |
0.499 |
2/3 |
2/3 |
0 |
| McHugh & Richardson thick glass target |
1.85-7 |
0.64 |
1.2 |
0 |
2/3 |
2/3 |
0.5 |
| Cour-Palais thick glass target |
1.85-7 |
0.53 |
1.06 |
0.5 |
2/3 |
2/3 |
0 |
| (1) Failure factors Kf: |
| |
- Thick plate: |
Kf => 3 |
Crater without spall |
| |
|
2.2 <= Kf < 3 |
Spallation of the plate |
| |
|
1.8 <= Kf < 2.2 |
Spall breaks away |
| |
|
Kf < 1.8 |
Perforation of the plate |
| |
- Thick glass targets: |
Kf => 7 |
Crater generation without spall |
| |
|
1.85 <= Kf < 7 |
Spallation of the plate |
| |
|
Kf < 1.85 |
Perforation of the plate |
| (2) K1 factors: |
| |
- Thick plate: |
Aluminum alloys: |
K1 = 0.33 |
| |
|
Stainless steel: |
K1 = 0.2 |
| |
- Thin plate: |
Aluminum alloys: |
K1 = 0.43-0.454 |
| |
|
Stainless steel: |
K1 = 0.255 AISI 304, AISI 306 |
| |
|
|
K1 = 0.302 17-4 PH annealed |
| |
|
Magnesium lithium: |
K1 = 0.637 |
| |
|
Columbium alloys: |
K1 = 0.271 |
| |
- McDonnell & Sullivan: |
Reference sigmat values given below |
| |
- Gardner: |
Input sigmat in Pa for this equation |
|
(3) The single wall ballistic limit equation for MLI assesses the
failure of the thermal blanket and was derived by tests and
hydro-code simulations.
|
|
|
Reference values for the 0.2 yield strength sigma used in
the McDonnell & Sullivan and Gardner equations
|
| Material |
xi (1) |
MPa |
| Aluminium pure |
10 |
70 |
| Aluminium alloys (superior) |
30-65 |
200-450 |
| Silver |
22 |
150 |
| Gold |
17.5 |
120 |
| Beryllium copper |
120 |
830 |
| Copper |
32 |
220 |
| Stainless steel |
110 |
760 |
| Titanium |
140 |
980 |
|
(1) xi = 1,000 lb in-2 = 6.895 MPa
|
|
3.1.2 The multiple wall ballistic limit equation
The parametric formulation of the multiple wall ballistic limit equation
is:
dp,lim = { [tb + K2
tsmu
rhosv2] /
[K1 rhopbeta
vgamma cosxialpha
rhobkappa Sdelta
rhosv1] }1/lambda
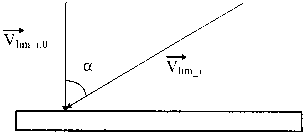 Three velocity regions are defined, delimited by the two limit velocities
vlim1 and vlim2.
The governing parameters mostly have different values for velocities below
vlim1 and above vlim2. For velocities
between vlim1 and vlim2, a linear
interpolation is performed. The limit velocities may vary with impact
angle:
vlim1 = vlim1,0
cosphi1 alpha
vlim2 = vlim2,0
cosphi2 alpha
When the normal velocity component is used (which is generally the case), i.e.
gamma = xi, the cosine exponents in the equations above
are phi1 = phi2 = -1.
The parameter values for typical multiple wall equations are given in
Tables 6 and 7 for double walls and multiple walls, respectively. For the
Cour-Palais, MLI and Maiden-McMillan equations, only one velocity domain is
used.
Table 6. Standard parameter values for the double wall ballistic limit
equation
| Equation |
K1 (1) |
K2 (2) |
lambda |
beta |
gamma |
kappa |
delta |
xi |
v1 / v2 |
mu |
| Cour-Palais |
0.044 (sigmay,ref/sigmay,t)0.5 |
0 |
1 |
0.5 |
1 |
0.167 |
-0.5 |
1 |
0 / 0 |
0 |
| MLI (3) |
0.034 (sigmay,ref/sigmay,t)0.5 |
0 |
1 |
0.5 |
1 |
0.167 |
-0.5 |
1 |
0 / 0 |
0 |
| Maiden-McMillan (1) |
Kf pi/6 (sigmay,ref/sigmay,t)0.5 |
0 |
3 |
1 |
1 |
0 |
-2 |
1 |
0 / 0 |
0 |
ESA (2) v < 3
v > 9.5
|
0.255 +/- 0.637
pi/6 (sigmay,ref/sigmay,t)0.5
|
1
0
|
1.056
3
|
0.519
1
|
0.875
1
|
0
0
|
0
0
|
0.875
1
|
0 / 0
0 / 0
|
1
0
|
|
(1) Failure factors Kf for the Maiden-McMillan equation:
|
| |
Kf => 41.5 |
No damage |
| |
8.2 <= Kf < 41.5 |
Incipient yield zone |
| |
7.1 <= Kf < 8.2 |
Fracture zone |
| |
Kf < 7.1 |
Penetration zone |
|
(2) ESA Equation:
|
| |
- The Boeing-ESA equation has the same form as the ESA equation,
but with
vlim1 = 1.4 km s-1
and
vlim2 = 7.83 km s-1.
|
| |
- The reference yield strength
sigmay,ref = 70,000 lb in-2 = 482.8 MPa.
|
|
(3) MLI Equation:
|
| |
The multiple wall ballistic limit equation for MLI asses the
debris/meteoroid protection of the thermal blanket, and was derived
by tests and hycro-code simulations using the Cour-Palais equation
as starting point.
|
|
Table 7. Standard parameter values for the multiple wall ballistic limit
equation
| Equation |
K1 |
K2 |
lambda |
beta |
gamma |
kappa |
delta |
xi |
v1 / v2 |
mu |
ESA v < 3
Triple v > 7
|
0.312 (tau1* / tau)0.5
0.107 (tau1* / tau)0.5
|
1.667 K1
0
|
1.056
1.5
|
0.5
0.5
|
2/3
1
|
0
0
|
0
-0.5
|
5/3
1
|
0 / 0
0.167 / 0
|
1
0
|
NASA v < 3
ISS v > 7
|
0.6 (sigmaw / 40)-0.5
[3.918 (sigmaw / 70)1/3]-1.5
|
(sigmaw / 40)-0.5
0
|
1.056
1.5
|
0.5
0.5
|
2/3
1
|
0
0
|
0
-0.5
|
5/3
1
|
0 / 0
0.167 / 0
|
1
0
|
NASA v < 3
Shock v > 6
|
0.3 (tau1* / tau)0.5
22.545 (tau1* / tau)0.5
|
1.233 K1
0
|
1.056
3
|
0.5
1
|
2/3
1
|
0
-1
|
0
-2
|
5/3
1
|
0 / 1
0 / 0
|
1
0
|
NASA v < 3
Bumper v > 6
|
0.4 (tau1* / tau)0.5
18.224 (tau1* / tau)0.5
|
0.925 K1
0
|
1.056
3
|
0.5
1
|
2/3
1
|
0
-1
|
0
-2
|
5/3
1
|
0 / 1
0 / 0
|
1
0
|
tau1* Is the yield stress of a reference
material (higher quality aluminium):
tau1* = 40,000 lb in-2 = 276 MPa.
sigmaw = 47 xi for the reference
equation used for system tests (to be input in xi).
|
3.1.3 The crater size equation
The parametric formulation of the crater size equation is very similar to the
single wall ballistic limit equation:
D = K1 Kc
dplambda
rhopbeta
vgamma cosxialpha
rhotkappa
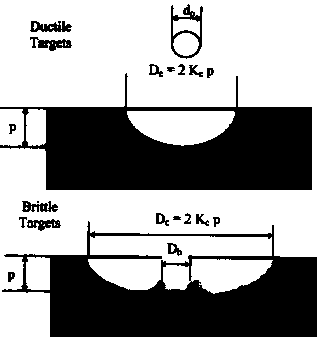 The crater factor Kc is the ratio of the crater radius
D/2 to the crater depth p.
The Kc factor can be classed in ductile and brittle
targets. For ductile targets, the crater is more or less spherical and
Kc is about 1. For brittle targets, an interior crater with
diameter Dh may form, the outer crater being much larger. For
brittle targets, Kc may be as high as 10.
Strictly speaking, the crater size equation is only valid when no failure
occurs. The crater size equation assumes a semi-infinite target and should only
be used for cases where the wall thickness is much larger than the particle
diameter.
The values of the parameters for the standard equations are given in
Table 8.
Table 8. Standard parameter values for the crater size equation
| Equation |
Kc |
K1 |
lambda |
beta |
gamma |
xi |
kappa |
| Ductile targets |
| Thick plate (1) |
2 |
0.4 +/- 0.66 |
1.056 |
0.519 |
2/3 |
2/3 |
0 |
| Shanbing et al. |
n/d (2) |
0.54 sigmay,t-1/3 |
1 |
2/3 |
2/3 |
2/3 |
-1/3 |
| Sorensen |
n/d (2) |
0.622 tau1-0.282 |
1 |
0.167 |
0.564 |
0.564 |
0.115 |
| Christiansen (3) for rhop / rhot < 1.5 |
n/d (2) |
10.5 Ht-0.25 cs2/3 |
1.056 |
0.5 |
2/3 |
2/3 |
-0.5 |
| Christiansen (3) for rhop / rhot > 1.5 |
n/d (2) |
10.5 Ht-0.25 cs2/3 |
1.056 |
2/3 |
2/3 |
2/3 |
-2/3 |
| Brittle targets |
| Gault |
n/d (2) |
1.08 |
1.071 |
0.524 |
0.714 |
0.714 |
-0.5 |
| Fechtig |
n/d (2) |
6.0 |
1.13 |
0.71 |
0.755 |
0.755 |
-0.5 |
| McHugh & Richardson |
n/d (2) |
1.28 |
1.2 |
0 |
2/3 |
2/3 |
0.5 |
| Cour-Palais |
n/d (2) |
1.06 |
1.06 |
0.5 |
2/3 |
2/3 |
0 |
| (1) K1 factors: |
| |
- Thick plate: |
Aluminium alloys: |
K1 = 0.66 |
| |
|
Stainless steel: |
K1 = 0.4 |
|
(2) n/d Means not defined in the equation reference. Default values
of 1 and 10 are used for ductile and brittle targets, respectively.
|
| (3) Christiansen equations: |
| |
- Ht Is the target Brinell
hardness. A typical value is 90.
|
| |
- cc Is the velocity of sound in
the target material. For steel,
cs = 5.85 km s-1.
|
|
3.1.4 The clear hole equation
The parametric formulation of the clear hole equation is:
D = [K0
(ts / dp)lambda
rhopbeta
vgamma cosxialpha
rhosnu + A]
dp
The clear hole equation is only valid for a full perforation, i.e. mainly for
thin foils (typically bumper shields or similar). The limit of validity is
given by the relation
ts / dp < 10.
The values of the parameters for the standard equations are given in
Table 9.
Table 9. Standard parameter values for the clear hole equation
| Equation |
K0 |
lambda |
beta |
gamma |
xi |
nu |
A |
| Maiden |
0.88 |
2/3 |
0 |
1 |
1 |
0 |
0.9 |
| Nysmith-Denardo |
0.88 |
0.45 |
0.5 |
0.5 |
0.5 |
0 |
0 |
| Sawle |
0.209 |
2/3 |
0.2 |
0.2 |
0.2 |
-0.2 |
1 |
| Fechtig |
5.24x10⁻⁵ |
0 |
1/3 |
2/3 |
2/3 |
0 |
0 |
3.1.5 Secondary ejecta
The process of secondary ejecta produced by hypervelocity impacts is relevant
to more complex spacecraft structures. Examples are ejecta from solar arrays on
the main satellite structure, or from baffles and other structures.
3.1.5.1 Normal impacts
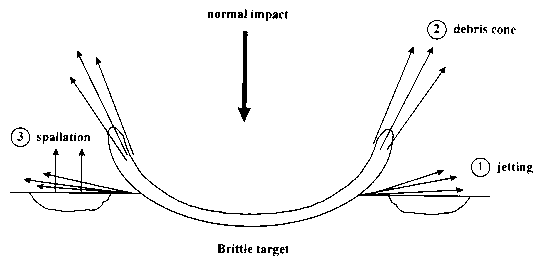
Material ejection under hupervelocity impact is divided in three processes
corresponding to different physical and mechanical phenomena: jetting phase,
debris cone formation and spallation. In general, no spalls are observed on
ductile targets. Figure 16 shows a schematic representation of ejection
processes under normal impact.
|
|
Figure 16. Schematic representation of ejection processes under normal
impact
|
The jetting phase
At the onset of penetration of the projectile into the target, both target and
projectile undergo partial or complete melting and vaporisation. A certain
amount of material is ejected from the impact interface. The physical state of
the ejected material is mainly liquid and the ejection angle is approximately
20° measured from the target surface. The ratio of jetted mass to toal
ejected mass is very small, less than 1%.
The debris cone
Later in the crater formation, the target material is finely commuted in fine
solid fragments by compression or tensile failure. These fragments are ejected
in a thin debris cone. The physical state of the ejected material is mainly
solid. The ejection angle is between 60° and 80° measured from the
target surface and depends on the target characteristics. The ratio of ejected
mass to total ejected mass is estimated between 50% and 70%. The ejection
velocity from a few m s-1 to a few km s-1 is
inversely proportional to fragment size. The minimum size depends mainly on
target characteristics and should be sub-micron sized. The maximum size can be
evaluated by empirical relations. The size distribution is inversely
proportional to the square of the fragment size.
The spallation phase
Near the free surface, rarefaction waves produce tensile stress. In brittle
material, tensile failure leads to the formation of spall fragments that are
ejected. The physical state of the ejected material is mainl solid. The
ejection direction is normal to the surface. The ejection velocity is less than
1 km s-1 and is 10 to 100 times less than the impact
velocity. The fragment size is large, about 10 times the size of debris cone
fragments. These fragments have plate shapes whose dimensions are difficult to
evaluate because large plate fragments are likely to fragment themselves into
smaller particles. The ratio of spalled mass to total mass is estimated between
30% and 50%. In general, no spallation is observed on ductile targets.
3.1.5.2 Oblique impacts
Two cases have to be considered separately:
- impact incidence angle > 30°, for which the ejecta process is
similar to normal impacts;
- impact incidence angle < 30°, for which a ricochet phenomenon
is observed.
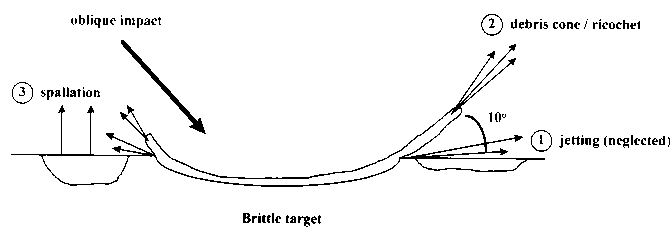
The impact angles are measured from the target surface. Figure 17 shows a
schematic representation of ejection processes under oblique impact.
|
|
Figure 17. Schematic representation of ejection processes under oblique
impact
|
Incidence impact angle > 30°
The phenomena involved in ejecta formation are similar to those observed for
normal impacts: jetting phase, debris cone formation and spallation phase. The
main differences are:
- the total ejected mass decreases with decreasing impact angle;
- the debris cone central axis remains vertical but the cone is flattened.
The debris cone ejection angle decreases with decreasing incidence angle.
- the problem is no longer axisymmetric as the obliquity of impact favours
the azimuth direction downstream of the incidence angle.
Incidence impact angle < 30°
For grazing incidence angles, the ricochet phenomenon appears and changes
completely the physical and mechanical behaviour of both target and projectile.
The projectile is probably not entirely consumed during impact and produces
large high velocity solid fragments. The target is less compressed but is torn
in the direction of impact. Experiments have shown that the ejecta are
concentrated in a thin cone with central axis at 10° from the target
surface. The fragments are mainly solid. The average size is larger than the
fragments produced in classical oblique impacts. The number of hypervelocity
fragments is dramatically increased.
4 Implementation in SPENVIS
For the particle/wall interaction model two versions are implemented in SPENVIS:
one based on the ESABASE user manual which corresponds to the above descriptions and
one on
the Handbook for Designing MMOD Protection
The following meteoroid and debris models are implemented in SPENVIS:
- Grün interplanetary flux model;
- NASA90 (outdated);
- MASTER-2009;
- Particle/wall interaction models:
- Based on ESABASE User Manual (ESABASE/GEN-UM-070, ESTEC, March 1994);
- Based on Micrometeoroid and Orbital Debris (MMOD) Shield Ballistic Limit Analysis Program
(TM-2009-214789, NASA, February 2010).
Anderson, B. J., Review of Meteoroids/Orbital Debris Environment, NASA
SSP 30425, Revision A, 1991.
Cour-Palais, B. G., Meteoroid Environment Model-1969, NASA SP-8013,
1969.
Drolshagen G., and J. Borde, ESABASE/Debris Meteoroid/Debris Impact Analysis,
Technical Description, Issue 1 for ESABASE version 90.1, 1992.
Grün, E., H. A. Zook, H. Fechtig, and R. H. Giese, Collisional Balance of
the Meteoritic Complex, Icarus, 62, 244-272, 1985.
Hechler, M., Collisional probabilities at geosynchronous altitudes, Adv.
Space Res., 5, 47-57, 1985.
Jenniskens, P., Meteor Stream Activity I, The annual streams, J. Astron.
Astrophys., 287, 990-1013, 1994.
Kessler, D. J., Space Station program definition and requirements, JSC
30000
Kessler, D. J., J. Zhang, M. J. Matney, P. Eichler, R. C. Reynolds, P. D.
Anz-Meador, and E. G. Stansbery, A Computer-Based Orbital Debris Environment
Model for Spacecraft Design and Observations in Low-Earth Orbit, NASA
Technical Memorandum 104825, 1996.
Lemcke, C., Enhanced debris/micrometeoroid environment models and 3D software
tools, Final Report of ESTEC Contract No. 11540/95/NL/JG, 1998.
Lemcke, C., G. Scheifele, and M.-C. Maag, Enhanced debris/micrometeoroid
environment models and 3D software tools, Technical Description of ESTEC
Contract No. 11540/95/NL/JG, 1998.
MBB-ERNO, Standard Methods for Analysis of Micrometeoroid and Orbital Debris
Impacts (MDPS Design Guideline), COL-MBER-000-RP-0022-03, 1988.
McBride, N., and J. A. M. McDonnell, Characterisation of Sporadic Meteoroids
for Modelling, UNISPACE KENT, 1996.
McCormick, B., Collision probabilities in geosynchronous orbit and techniques
to control the environment, Adv. Space Res., 6, 119-126, 1986.
Oswald, M. et al., Upgrade of the MASTER model,Final Report to ESOC Contract 18014/03/D/HK(SC), 2006.
Sdunnus, H., Meteoroid and Space Debris Terrestrial Environment Reference Model
"MASTER", Final Report to ESOC Contract 10453/93/D/CS, 1995.
Taylor, A. D., The Harvard Radio Meteor Project meteor velocity distribution
reappraised, Icarus, 116, 154-158, 1995.
Taylor, A. D., W. J. Baggaley, and D. I. Steel, Discovery of interstellar dust
entering the Earth's atmosphere, Nature, 380, 323-325, 1996.
This page is based on Drolshagen and Borde [1992], Lemcke [1998], and Lemcke
et al. [1998].
Last update: Mon, 12 Mar 2018


 The first wall is penetrated by the impacting particle, but this primary impact
shatters the impactor into a cloud of small debris particles which may be
solid, liquid or vaporised, and which are less harmful to the back-up wall than
one single particle. The multiple wall design is characterised by the material
densities and thicknesses of back-up wall and shield, as well as the spacing
between shield and back-up wall. For multiple walls composed of several
shielding layers, the analyis uses the summed thickness of the shields and the
averaged spacing for the equation formula. A typical case is when a specific
micro-particle shielding or thermal protection (MLI) is applied to the basic
structure. Due to the increasing concern of the risk posed by the
micro-particle environment of long term missions (above all the international
space station), special micro-particle shields have been developed.
 Three velocity regions are defined, delimited by the two limit velocities
vlim1 and vlim2.
The governing parameters mostly have different values for velocities below
vlim1 and above vlim2. For velocities
between vlim1 and vlim2, a linear
interpolation is performed. The limit velocities may vary with impact
angle:
 The crater factor Kc is the ratio of the crater radius
D/2 to the crater depth p.
The Kc factor can be classed in ductile and brittle
targets. For ductile targets, the crater is more or less spherical and
Kc is about 1. For brittle targets, an interior crater with
diameter Dh may form, the outer crater being much larger. For
brittle targets, Kc may be as high as 10.

